You are using an out of date browser. It may not display this or other websites correctly.
You should upgrade or use an alternative browser.
You should upgrade or use an alternative browser.
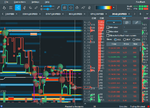
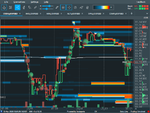
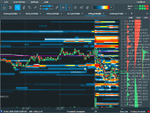
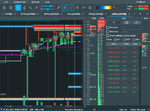
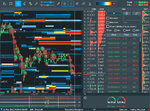
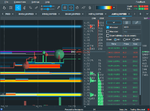
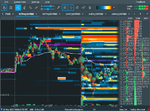
13/03/20 trading $OPK. High level liquidity of sellers at 2.5$ area at premarket, buyers get stuffed and price goes down. At open buyers try to push and get stuffed at 2.2$ and flush
Attachments
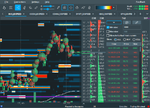
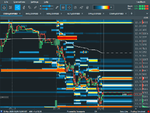
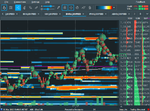
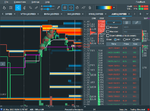
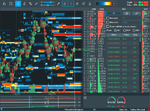
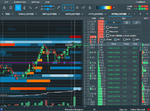
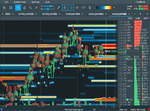
18/03/20 trading $BMRA. High liquidity levels of buyers push the price up, enter long at 5.8$ and after at 6$. Going through the POC line, liquidity of sellers at 7$- a whole dollar number, a good place to short, for a pullback to the POC line.
Attachments
Last edited:
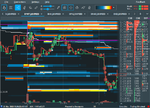
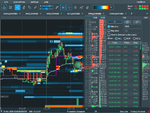
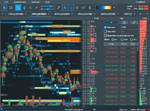
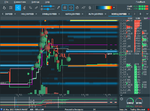
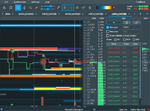
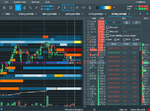
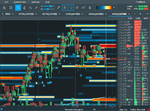
23/03/20 trading $AMRX. Stack of buyers in pre market, the liquidity of sellers is going of the chart no resistance to hold them. long at 4$ area and can add when see the liquidity line of new buyers few cents above. The pic line is above, good indicator to where the price will go.
Attachments
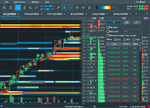
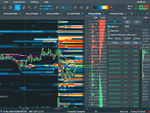
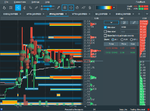
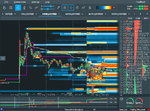
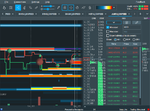
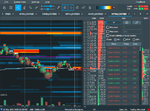
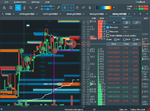
23/03/20 trading $WTRH. Algo/big buyer is setting at 2$, a whole round number, stacking big which creates imbalance, short at 2$ area. move to the down side continue at open
Attachments
Similar threads
- Replies
- 8
- Views
- 5K

