You are using an out of date browser. It may not display this or other websites correctly.
You should upgrade or use an alternative browser.
You should upgrade or use an alternative browser.
19/02/20 trading $TIVO. Long red bar implies big seller at 8.4$, the area been tested few times and rejected. After push again and sellers level at 8.3$ for lower high, short
Attachments
20/02/20 trading $BBI. Catalyst stock, buyers adding up on 2.5$ in pre market for the push at open get fueled at 3.13$ to push more, long
Attachments
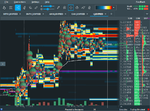
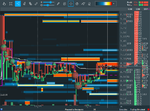
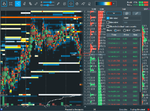
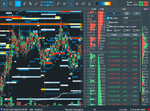
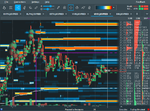
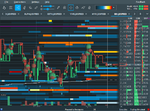
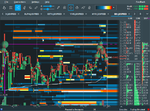
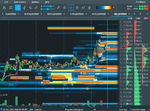
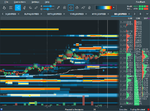
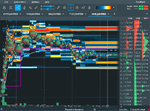
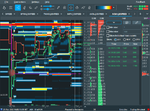
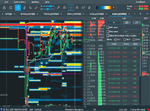
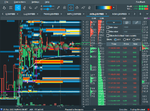
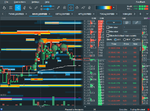
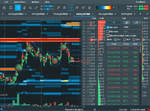
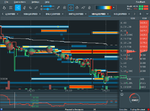
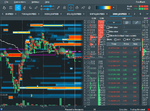
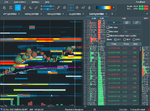
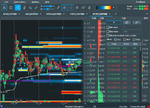
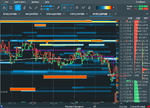
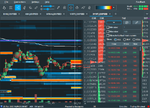
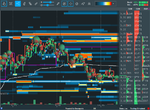
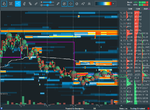
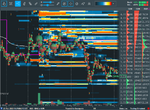
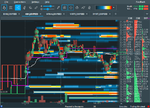
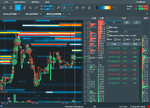
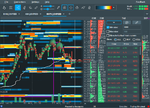
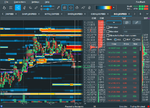
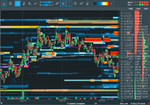
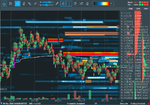
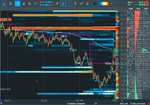
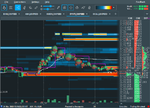
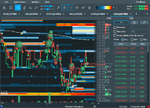
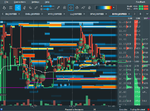
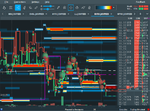
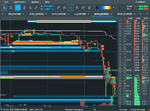
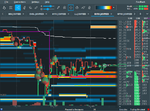
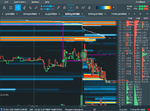
21/02/20 trading $BXRX. Big seller at 11.5-11.4$ at pre market, making small time frame lower highs, in 10.86$ jump in the big gun after reversal, buyers coming in at 10.5$ just to get smashed again
Attachments
-
 BXRX@DXFEED_screenshot_20200221_124259_275.png124 KB · Views: 183
 -
 BXRX@DXFEED_screenshot_20200221_133220_114.png115.1 KB · Views: 179
 -
 BXRX@DXFEED_screenshot_20200221_133658_162.png71.1 KB · Views: 183
 -
 BXRX@DXFEED_screenshot_20200221_134205_460.png92.1 KB · Views: 187
 -
 BXRX@DXFEED_screenshot_20200221_143228_907.png93 KB · Views: 202
25/02/20 trading $MNK. On the downside fueled by high liquidity of sellers at 5.9$, short
after the stock pop again to 6.25$ and the previous level of 6$ got filled with sellers again, short
after the stock pop again to 6.25$ and the previous level of 6$ got filled with sellers again, short
Attachments
28/02/20 trading $DYNT. Resistance at 5.2$ on pre-market, with no buying pressure, the tape shows the imbalance, and the short fueled with more sellers on 4.5$ and 3$
Attachments
04/03/20 trading $INO. Big resistance of sellers on 9.5$ area, starting to push down from 9.4$, and a big hand joining at 9.2$ for the flush, short
Attachments
Similar threads
- Replies
- 8
- Views
- 5K

