dbphoenix
Guest Author
- Messages
- 6,954
- Likes
- 1,266
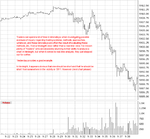
Keep a vertical line chart showing the daily movements of any of the well-known averages. Use these to indicate when the market is in a trading area or whether it is moving to another level, upward or downward. You do not care which way it goes, or when; but you need these averages for a broad picture of the market . . .
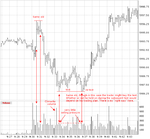
Your vertical line chart of these averages should also show the volume of the day's trading -- the total sales for the day. This is very important because it aids in forming your judgment of the prevailing trend. Your individual stock [or futures, ETFs, whatever] chart should also show the volume of the day's trading in that stock, so that you may observe whether this volume increases or decreases on the advances and declines. Increases serve to emphasize the bullishness or bearishness. Decreases warn you of a probable reversal in direction. [NB. Today, of course, we also have access to intraday volume, and everything Wyckoff says above applies intraday as well.] . . .
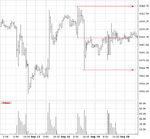
The upper and lower boundaries of these trading swings represent the points (at the tops) where supply overcomes demand and (at the bottoms) where demand exceeds supply. Unless the action of your stock indicates that it is going out of its present trading range, your purchases should be made around the bottoms of these short swings and your sales, long or short, around the tops. This seems a simple thing, but very few people can do it . . .
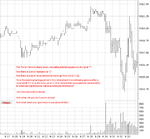
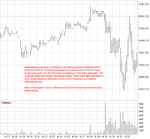
If it is swinging between 30 and 35 you should give increasing attention to its buying opportunities as it approaches 30, and its selling as it nears 35. This does not mean that you are to buy or sell at or near those points, but that you are to watch out for chances for profit indicated by the action of your stock on the [chart]. You never know, when a stock approaches the upper or lower levels of a trading range whether, this time, it will go on through; so you do not take a position until you have all the facts assembled . . . (Richard Wyckoff)

