dbphoenix
Guest Author
- Messages
- 6,954
- Likes
- 1,266
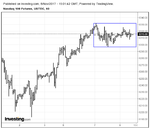
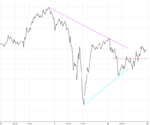
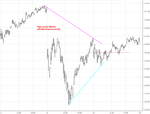
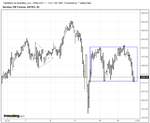
The above chart appears to have sparked some interest, so I'll provide a blow-up of what's contained inside that hinge so that one can see the choices he has in playing this sort of thing. Or at least playing it in terms of trading price.
Every trader is forced to read price from left to right when he's observing or trading a live streaming feed. One cannot trade what's past. Or passed. Nor can one trade what hasn't happened yet (though one can prepare for it). But newcomers and struggling traders almost invariably forget all that when examining static charts. Rather than read the chart from left to right, they read it from right to left, and the first thoughts coming to mind begin with "if only". This makes the process of review pretty much a waste of time.
In this case, one doesn't know what's ahead, so, if he's following the SLA rules, for example, he'll be tracking supply and demand, perhaps with supply and demand lines or perhaps just in his head. He'll exit on the breaks and trade the opposite side. And exit on the breaks and trade the opposite side. And during all this, he'll rack up multiple small wins and multiple small losses and multiple BEs (breakevens). And at some point, he will likely say the hell with this and stop and head to the kitchen. During which price will take off without him and he's screwed up again.
All of which can be avoided by paying attention to the sense of the SLA and not getting entangled in mechanical rules (much less "confirmations" from MAs or Fib or an oscillating something-or-other). In this case, if one is trading in real time (technically, trading couldawouldashoulda isn't real trading), he will not be able to avoid the fact that his stops are being tripped a lot, or that his wins are sort of pitiful (or that his losses, though mercifully small, are being racked up as well). At this point he can either slump in a frustrated funk or turn his attention away from himself and whatever frustration he may feel and look at what's in front of him. In the example, presented here, he backs away from the trees (prompted by all the exits and small wins/losses) and looks at the forest. And when he does that, he understands the sense of what has been behind price's lack of progress in moving either up or down and his consequent lack of progress in making some money.
This particular hinge provides a good example of the difference between seeing the sense of what's in front of him and being OCD about mechanics. In this case, the median is not quite the median and it's definitely not the mean. But the line as drawn does approximate that level toward which buyers and sellers are dovetailing in order to arrive at their respective estimations of value. And this can be done in time for the trader to notice that a move upward away from this level "fails" and that a move downward from this level also "fails", and that the move downward is considerably less severe than the preceding move up. So what are his choices as price works its way back toward the "value line"? Enter a sell stop below the low of the move downward and a buystop above the high of the move upward. One can see from the previously-posted chart above how all this works out.


