You are using an out of date browser. It may not display this or other websites correctly.
You should upgrade or use an alternative browser.
You should upgrade or use an alternative browser.
Trading the ES (E mini S&P) November 2003
- Thread starter stoploss please
- Start date
- Watchers 6
- Status
- Not open for further replies.
stoploss please
Established member
- Messages
- 780
- Likes
- 10
stoploss please
Established member
- Messages
- 780
- Likes
- 10
riddle
Long of the break of 1055 then cover and short at 1060 where we have the triple top going back to 3/11/03.
Andy
Long of the break of 1055 then cover and short at 1060 where we have the triple top going back to 3/11/03.
Andy
stoploss please
Established member
- Messages
- 780
- Likes
- 10
stoploss please
Established member
- Messages
- 780
- Likes
- 10
The afternoon session
Well, the retracement was more than I expected with B reaching
the 25% mark. The spike above the 12/11 highs may have caught a few bulls on the wrong side. Once the hanging man formed beneath resistance, the bears could take hope. C is now at the
13/11 lows.
Well, the retracement was more than I expected with B reaching
the 25% mark. The spike above the 12/11 highs may have caught a few bulls on the wrong side. Once the hanging man formed beneath resistance, the bears could take hope. C is now at the
13/11 lows.
Attachments
stoploss please
Established member
- Messages
- 780
- Likes
- 10
Close 14/11
The bars kept heading south. I was looking for a change of
direction to weak up or neutral at 1052 but the moment was with the bears. We got the bounce just beneath the low of 12/11.
We are now 7 points off the double bottom so support should be found in that area.
Back to EW to work out the next possible pattern. EW principle, the cure for all insomniacs.
Happy weekend.
Attachments
china white
Established member
- Messages
- 979
- Likes
- 12
classic
amazing day
1st hour - MACD of tick is not reliable (5,35,10 on 5 min) so u just go for tick divergencies.
rest of day - 2 trades: 1 short 1 long. 22 pts in the bag - and that was not getting the best executions......
wish every day was like this Friday.... :cheesy:
amazing day
1st hour - MACD of tick is not reliable (5,35,10 on 5 min) so u just go for tick divergencies.
rest of day - 2 trades: 1 short 1 long. 22 pts in the bag - and that was not getting the best executions......
wish every day was like this Friday.... :cheesy:
Attachments
Trader333
Moderator
- Messages
- 8,766
- Likes
- 1,030
It is interesting that from what has been said above everyone
made a profit trading the ES this Friday and quite large profits
as well. The method I am developing also made profit but not as
large and in the end made about 3.5 points but that is still $175
on a single contract and most days it will give this.
Paul
made a profit trading the ES this Friday and quite large profits
as well. The method I am developing also made profit but not as
large and in the end made about 3.5 points but that is still $175
on a single contract and most days it will give this.
Paul
china white
Established member
- Messages
- 979
- Likes
- 12
Paul,
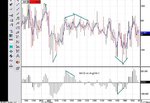
top part is NY Up/Down ratio - Tick. lower one - is MACD(5,35,10) of Tick
The numbers on top got cut off a bit - sorry for the quality of my graph. I usually keep HOD and LOD of tick constantly displayed in the left top corner.
top part is NY Up/Down ratio - Tick. lower one - is MACD(5,35,10) of Tick
The numbers on top got cut off a bit - sorry for the quality of my graph. I usually keep HOD and LOD of tick constantly displayed in the left top corner.
stoploss please
Established member
- Messages
- 780
- Likes
- 10
fillyerboots
Member
- Messages
- 94
- Likes
- 0
Hey, all fellow IB Users out there Globex margins have been raised. ES is now US$2000 intraday, $4000 o/night.
stoploss please
Established member
- Messages
- 780
- Likes
- 10
stoploss please
Established member
- Messages
- 780
- Likes
- 10
Well, I went long at 1037.70 thinking that we had put in a bottom at 1036 and then in went all Pete Tong.
- Status
- Not open for further replies.


