Time & Price, Volume Confirms

and you are a moderator?


kinda sums up an earlier post about quality and lack of

and you some multi-nik troll sent over to run rampage all over the shop.

If I were you, I'd stay well under the radar, don't say I didn't warn ya.
 
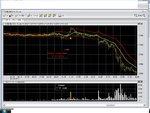
Is that what r u talking about Rob ? big spike in volume in 6E futures 5 min chart then sideways , but the initial direction ( up ) was just around 20-25 pips is that enough ?
 

Attachments

  • 6e.jpg
    6e.jpg
    133 KB · Views: 289
Is that what r u talking about Rob ? big spike in volume in 6E futures 5 min chart then sideways , but the initial direction ( up ) was just around 20-25 pips is that enough ?

Two things that would discount that for me:

1) Price has been trading sideways for a while - there is not a definitive trend going on for the TF

2) The Volume spike is really large compared to previous trading volumes. In itself it is interesting but the lack of change of price over time would mean I would discount it.

Maybe 6E has it's own variation of the theme that I can't see.

Ok the up move was small but it is around 24 pips , currently the 9D ATR for 6E is around just 70 pips , so thats around 1/3 ATR , what move are you looking for in the ES how many handles ?
 
Ok the up move was small but it is around 24 pips , currently the 9D ATR for 6E is around just 70 pips , so thats around 1/3 ATR , what move are you looking for in the ES how many handles ?

It's timeframe contextual.

Yesterday's move of 2.5 hrs was about 13pts.

The example from 26th Feb I posted on FoMo's thread (link here - http://www.trade2win.com/boards/tra...et-make-consistent-profit-15.html#post2287428 ) 8pts.

What I am usually looking for is a pronounced trend in a single direction indicating a continuous buy or sell side orderflow imbalance that would need a sizeable amount of liquidity to stop it.

Throwing a figure out of the air - probably looking at a 5-6pt move minimum so it is outside of the large end of a 15 min rotation.
 
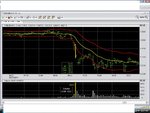
Would you ignore that one in this example as well ? We had a direction in the 6E , spike in volume but the price didnt really stall it stretched a bit more .
The question is : Should the candle with the volume spike has the hi/lo of the move or not necessarily ?
 

Attachments

  • 6e2.jpg
    6e2.jpg
    121.1 KB · Views: 285
Would you ignore that one in this example as well ? We had a direction in the 6E , spike in volume but the price didnt really stall it stretched a bit more .
The question is : Should the candle with the volume spike has the hi/lo of the move or not necessarily ?

That is a really good example but I am referring to the volume spike that happened afterwards with 4k contracts.

The indication of the stall from the volume does not mean that price always stops dead. If it is a big move for the TF you are looking at and supported by quite a bit of volume, the orderflow will have some momentum behind it and move a little lower before stopping and turning.

Rule of thumb - the bigger the move, the more latitude you need to give for price creeping a bit further up or down.

One of the problems with this method is that you are catching a falling knife so be prepared to get taken out a couple of times before it finally starts trading sideways. Applying a 3 strikes and out for the day mentality stops you from constantly trying to fade a trend day too.

Obviously if you have 2 losers at say 6 ticks on ES and then a winner of 8 pts, you can see that it generally has a +ve expectancy even on a low win%
 
Last edited:
That is a really good example but I am referring to the volume spike that happened afterwards with 4k contracts.

The indication of the stall from the volume does not mean that price always stops dead. If it is a big move for the TF you are looking at and supported by quite a bit of volume, the orderflow will have some momentum behind it and move a little lower before stopping and turning.

Rule of thumb - the bigger the move, the more latitude you need to give for price creeping a bit further up or down.

One of the problems with this method is that you are catching a falling knife so be prepared to get taken out a couple of times before it finally starts trading sideways. Applying a 3 strikes and out for the day mentality stops you from constantly trying to fade a trend day too.

Obviously if you have 2 losers at say 6 ticks on ES and then a winner of 8 pts, you can see that it generally has a +ve expectancy even on a low win%

Yes tight SL and a daily limit is key or u will get chopped to death .
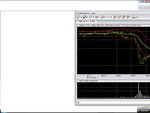
So we have the first one with 8K and the second one an hour later with 4 K , both had an extension in price "afterwords" , which one would you take and why ? its a bit tricky ...
 
Yes tight SL and a daily limit is key or u will get chopped to death .
So we have the first one with 8K and the second one an hour later with 4 K , both had an extension in price "afterwords" , which one would you take and why ? its a bit tricky ...

The second.

The first is the initiation of a bigger move.

Look at the example yesterday from me. I didn't take the big one at the beginning, I looked for a smaller one once the move was coming to exhaustion indicated by Time & Price

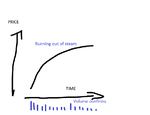
Time & Price shape looks like this. Volume confirms.
 

Attachments

  • TPV.png
    TPV.png
    15.8 KB · Views: 259
The second.

The first is the initiation of a bigger move.

Look at the example yesterday from me. I didn't take the big one at the beginning, I looked for a smaller one once the move was coming to exhaustion indicated by Time & Price

Time & Price shape looks like this. Volume confirms.

Why not after the first one ? price stalled for sometime "but started to reverse a bit" , and we had a volume spike earlier ....
 

Attachments

  • 6e3.jpg
    6e3.jpg
    73.9 KB · Views: 261
Experience has taught me to wait for a second one typically.

On a very sharp move that is done in 10-12 minutes I will often take the first sign. On a more measured move I will wait for the second. Context again, day type, whether it is trading out of yesterday's range, etc, etc.
 
It's timeframe contextual.

Yesterday's move of 2.5 hrs was about 13pts.

The example from 26th Feb I posted on FoMo's thread (link here - http://www.trade2win.com/boards/tra...et-make-consistent-profit-15.html#post2287428 ) 8pts.

What I am usually looking for is a pronounced trend in a single direction indicating a continuous buy or sell side orderflow imbalance that would need a sizeable amount of liquidity to stop it.

Throwing a figure out of the air - probably looking at a 5-6pt move minimum so it is outside of the large end of a 15 min rotation.


Rob

Not sure I'm going to explain this very well, but does the size of the volume spike price bar feature in your thinking in any way?

I don't trade ES, as you know, but on the equity front there is often bursts of interest in a particular share with a normal 2 daysworth (or whatever) of business packed into 1 day. This shows up as a "volume spike" but it's associated with an equally strong move in the trend direction. If you ironed it out over two days it would look nothing abnormal and could just as well be down to increased interest from the smaller potatoes as to the entry into the fray of the big boys.
 
Yes but not in the way you describe. The volume bar that I use as confirmation has to be disproportionately large in relation to the average, diminishing order flow coming through.

There are no absolute indicators here and if you are looking for one, you won't find it.....
 
Yes but not in the way you describe. The volume bar that I use as confirmation has to be disproportionately large in relation to the average, diminishing order flow coming through.

There are no absolute indicators here and if you are looking for one, you won't find it.....

ok, thx.

I forgive you, my son, for suggesting that I might be on a fruitless search for a tablet of stone :LOL:
 
Yes but not in the way you describe. The volume bar that I use as confirmation has to be disproportionately large in relation to the average, diminishing order flow coming through.

There are no absolute indicators here and if you are looking for one, you won't find it.....

Hi Robster,

Just out of interest, what are your views on people trading even without using the volume as an indicator, let alone any other indicators.

Best John.
 
ok, thx.

I forgive you, my son, for suggesting that I might be on a fruitless search for a tablet of stone :LOL:

Its nice being back Jon. Even WallStreetWarrior87 has poked his head in today.

130312d1330074496-averaging-down-losing-position-mean-reverting-situation-bishop-john-gives-his-blessing_articleimage.png
 
Last edited:
Hi Robster,

Just out of interest, what are your views on people trading even without using the volume as an indicator, let alone any other indicators.

Best John.

I think it is like driving in fog. Possible but you are hampering the quality of your trade selection and therefore placing greater emphasis on entry timing and exit timing to skew your r:r higher to compensate for a lower win%

Wrt to indicators, I think they are b0llocks unless you are using them to see where other people may want the trade and you have a strategy which games them or aids you in some way.

Each to their own though. Plenty of ways to skin the cat and trading is a broad church.
 
I think it is like driving in fog. Possible but you are hampering the quality of your trade selection and therefore placing greater emphasis on entry timing and exit timing to skew your r:r higher to compensate for a lower win%
.

You mean for daytraders and scalpers ? Because many may swing or position trade normally without even looking at the volume ...
 
Top