You are using an out of date browser. It may not display this or other websites correctly.
You should upgrade or use an alternative browser.
You should upgrade or use an alternative browser.
brutusdog
Guest
- Messages
- 759
- Likes
- 194
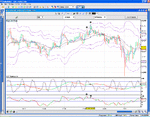
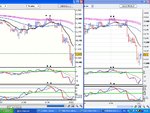
another attempt at puppy-spotting (can you get arrested for this?)
Spanish Ibex 3-mins today.
(price prints a higher-high, and the stochs(39,2,8) pritns a lower-high.
thats spot on, did you trade it trendie, i havent tried this too much on fx yet but am going to start using it for a test run on cable😎
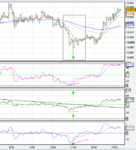
just looked at yesterdays cable chart 3min, perfect puppies at around 10am, great oppertunity, see you on the fx thread sometime..
Last edited:
trendie
Legendary member
- Messages
- 6,875
- Likes
- 1,433
thats spot on, did you trade it trendie, i havent tried this too much on fx yet but am going to start using it for a test run on cable😎
phew - thats a relief.
didnt trade it - am merely monitoring it and getting confident about spotting them.
must say, the 3-mins Indices are attracting me away from FX!
brutusdog
Guest
- Messages
- 759
- Likes
- 194
phew - thats a relief.
didnt trade it - am merely monitoring it and getting confident about spotting them.
must say, the 3-mins Indices are attracting me away from FX!
im looking at the hourlies on cable for slightly longer term trades, was trading cable before but not been at one with it reacently but the analysis on the thread has helped.
the thing with the puppies is to have some kind of confirmation, im using rsi21 as per bago and also an macd, seems pretty good for me so far😉
fibonelli
Experienced member
- Messages
- 1,338
- Likes
- 288
another attempt at puppy-spotting (can you get arrested for this?)
Spanish Ibex 3-mins today.
(price prints a higher-high, and the stochs(39,2,8) pritns a lower-high.
Hi Trendie,
I see you use two sets of Bolly Bands as well. 😎
Fibonelli
another attempt at puppy-spotting (can you get arrested for this?)
Lol. No. Only for handling 'puppies' without the owners consent!
Aside from that. Spot on guv.
BD: Yes m8, that's what I've been finding. At key points, you get better moves of course. So when no key points around be ready to scalp. Works on any chart any time frame.
Quantify it? Well I do use fibs and my own angles on occasion. But these work better on longer frames from an hour upward. On a short time frame you stand a very good chance of too many indicators, confusion and running out of time while you try to analise and end up with scrambled brain not knowing which way to go. As always. K.I.S.S.
trendie
Legendary member
- Messages
- 6,875
- Likes
- 1,433
Hi Trendie,
I see you use two sets of Bolly Bands as well. 😎
Fibonelli
yep, gives the (illusory 🙂) sense of containment, and potential points for low-risk pull-back entries, or stop-loss zone.
you might also note I have the "Jimmer slingshot" stochs to identify pull-backs.
I use these as a baseline to compare new ideas against.
quite a mind-flip to be seeking out reversals, rather than looking for pullbacks into a newly established trend.
but hopefully worth the effort.
hope your trading is going well.
"quite a mind-flip to be seeking out reversals, rather than looking for pullbacks into a newly established trend.
but hopefully worth the effort."
Just another arrow to add to the quiver.This is why it lends itself to the short time frame.
Against the main trend = smaller moves.
Coming back in line with the main trend can act as an additional topping up point, or entry to the ride, then either play that time frame or try to feed it out to a longer one, and aim for a daily one that lasts a year or so.
rathcoole_exile
Guest Author
- Messages
- 3,925
- Likes
- 767
another attempt at puppy-spotting (can you get arrested for this?)
Spanish Ibex 3-mins today.
(price prints a higher-high, and the stochs(39,2,8) pritns a lower-high.
Trendie, not so sure about this one - surely a puppy is when you've got 2 adjacent highs with divergent indicators ? From what I can tell your first puppy isn't a high, it's a sick dog. Yes the price peaked at one stage but it fell back to close lower.
Senor Options, does this count even if the closing price dropped from the ohlc bar high ? I would have thought a high close would be needed, am I wrong ?
garry
rathcoole_exile
Guest Author
- Messages
- 3,925
- Likes
- 767
sorry everyone, i went back and had a look at your charts. it seems you're all using highs not closes to spot your puppies. i'll check first before posting next time 😱
No Rathcoole. It is good. It doesn't matter if it is a 'sick puppy'. It made the high and counts as a first point, the second point takes out the previous one and you have the 2nd 'pup'.
The 'pups' can come over a period of bars, (usually the wider the period the bigger the move). (And I like playing with big ones personally). And they count even if you have a 'double top'. IE both 'pups' at the same high point. It is the lower indicators that clarify the 'puppies'. It is, after all a divergence indicator, and we are looking at and for, a probable entry to give us some pips/points with relative 'comfort'.
This is nothing new, and has been around since charts were first drawn by hand. (Damn! I remember those days)
I think this thread has garnered a bit more attention and opened peoples eyes to what they knew was there before, but couldn't be bothered to give it a go themselves, as they didn't want to make the effort of learning yet another new thing. When in fact it is simplicity itself and people are attracted by 'playing with puppies'. Because it is a bit more naughty then your average, boring technical analysis.
New motto: Free some puppies today and play with them for at least a couple of hours!
rathcoole_exile
Guest Author
- Messages
- 3,925
- Likes
- 767
Hola Senor, buenas tardes.
i've been thinking about these puppies and i'd like to keep them in a seperate kennel away from my Big Dogs - i don't want them peeing up their legs or generally getting in the way at meal times when the pack is hungry. Could get messy !
As you know, I use optionsXpress for writing most of my big dog business....
Looking at brokers' fees, bid/ask spreads etc, can you recommend a brokerage more suitable for housing my puppy trades ? Go on, throw a bone my way ......No ? A squeaky toy perhaps ? ..
garry
brutusdog
Guest
- Messages
- 759
- Likes
- 194
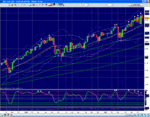
puppies on the weekly FTSE at the moment 😱
enjoy
nice one fib, going to keep that in mind and watch it closely for shorter term trades😀
brutusdog
Guest
- Messages
- 759
- Likes
- 194
Hola Senor, buenas tardes.
i've been thinking about these puppies and i'd like to keep them in a seperate kennel away from my Big Dogs - i don't want them peeing up their legs or generally getting in the way at meal times when the pack is hungry. Could get messy !
As you know, I use optionsXpress for writing most of my big dog business....
Looking at brokers' fees, bid/ask spreads etc, can you recommend a brokerage more suitable for housing my puppy trades ? Go on, throw a bone my way ......No ? A squeaky toy perhaps ? ..
garry
From out there. Not too sure. see if you can cmc. or one of the other sb co's. Seeing as it starts off as primarily a scalping move you need tight spreads.
Well done fibs and BD
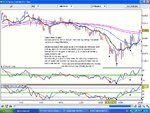
A pair of akward pupies on the dow
As it turns out this move only offered 20 points before giving a reversal signal as I type.
So in reality you may only have nabbed from between 10 and 15 from it.
Depending on where you got in the current price may not have taken out your stop and you could still be in trade.
The time is just before market open. So not a good time to trade the 'puppies'.
Attachments
trendie
Legendary member
- Messages
- 6,875
- Likes
- 1,433
when trading pull-backs, the previous high or low becomes the logical stop-loss.
but, when you are trading a reversal, how do you quantify your stop-loss?
ie; how much do you risk?
(I would lean towards using some boll-bands, as some statistical form, but need to try it out real-time)
I appreciate we are in active trading time for Dow, so take your time with replies!
PS: I have started to see more and more of these patterns, and its doing my head in.
brutusdog
Guest
- Messages
- 759
- Likes
- 194
when trading pull-backs, the previous high or low becomes the logical stop-loss.
but, when you are trading a reversal, how do you quantify your stop-loss?
ie; how much do you risk?
(I would lean towards using some boll-bands, as some statistical form, but need to try it out real-time)
I appreciate we are in active trading time for Dow, so take your time with replies!
PS: I have started to see more and more of these patterns, and its doing my head in.
Trendie, personally i would suggest that there is either 2 ways of placing the stop.
As this is for trading a reversal or retracement, to place the stop outside the low or high that is being traded against. therefore if this is broken i am happy to say the reversal will not take place yet.
or
have a fixed risk to reward and scale out. eg. stop 10 points away. target 20 point gain, when hit close half position and let the rest ride.
i have been predominantly trading the puppies on binaries where i am looking to get 2:1 risk to reward.
it's also worth noting that when spread betting it is possible to minimize the effect of the bias in the spread if an early entry is gained.😀
In a nice way I hope. Don't worry. It becomes clearer over time. And you will be able to pick out the best trades to go with. Knowing as well, that if you do f*ck it up you are only down to lose a tiny bit.when trading pull-backs, the previous high or low becomes the logical stop-loss.
but, when you are trading a reversal, how do you quantify your stop-loss?
ie; how much do you risk? Same way me ole son
(I would lean towards using some boll-bands, as some statistical form, but need to try it out real-time) Up to you to use whatever you feel comfortable with. But price has just printed a high or a low a few bars or at least one bar back before you enter trade. So you can see where the obvious stop should go. Yes?
I appreciate we are in active trading time for Dow, so take your time with replies!No probs. Me done for day now on Dow. 100 points in just over the hour (Bit slow really) see attached chart. Exit was at sup line. I would not like to enter a pullback trade against that run down until there is more confirmation.
PS: I have started to see more and more of these patterns, and its doing my head in.
Today the Ig chart gave the best signals. So it looks like I will be running both back to back. Cmc is very hungry resource wise. So I won't be posting a lot during key dow times. I even tried to open my fxcm software but comp threw a wobbly and told me to f off 😱
Attachments
Similar threads
- Replies
- 12
- Views
- 12K

