You are using an out of date browser. It may not display this or other websites correctly.
You should upgrade or use an alternative browser.
You should upgrade or use an alternative browser.
The Three Keys
- Thread starter Lightning McQueen
- Start date
- Watchers 27
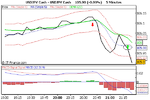
Here is the outcome.
Should have held longer. Lost out on a potential +15 pips.
To analyse MACD misled me there.
Looking for another opportunity now.
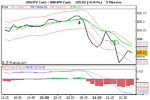
MACD misled me, too, on the 5 min FT and SP500. I didn't trade it because it was a bottom and one should never try to spot a new trend. Besides, the way things were today it didn't seem a good idea :idea: Nevertheless, there were thirty or more points in it, up to a strong down average, where it was turned back. Balls of steel. That's what we have to have!!
Split
Atilla
Legendary member
- Messages
- 21,035
- Likes
- 4,206
Looks like it's still going down.
I'm now wondering if at 5min charts MACD is worth considering. Sounds like noise to me. Perhaps I have polluted your system for the worse.
I do like MACD especially with my 4hr charts. May need to watch this combination with 5min charts.
I'm now wondering if at 5min charts MACD is worth considering. Sounds like noise to me. Perhaps I have polluted your system for the worse.
I do like MACD especially with my 4hr charts. May need to watch this combination with 5min charts.
Attachments
Atilla
Legendary member
- Messages
- 21,035
- Likes
- 4,206
MACD misled me, too, on the 5 min FT and SP500. I didn't trade it because it was a bottom and one should never try to spot a new trend. Besides, the way things were today it didn't seem a good idea :idea: Nevertheless, there were thirty or more points in it, up to a strong down average, where it was turned back. Balls of steel. That's what we have to have!!
Split
Wow, snap Splitlink. I've just seen your post after my last one and obviously we were thinking the same thing.
Hear what you saying about bottoms on the 1 hour it's flat and on my 4 hour it may be levelling out. Not the best of confirmations.
I wanted to test drive the 3Keys live see how it would go.
I've just seen my DEMA22 breached. MACD confirming rise. If I had balls of steel I'd go long. But I don't think I will.
Attachments
Atilla
Legendary member
- Messages
- 21,035
- Likes
- 4,206
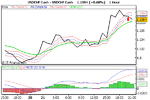
Ok here is another on the 1 hour charts. Short @ 1.1085. SL @1.11
This is based on price cutting below the -0.05% MA5. I would have liked price and MA5 to cross my DEMA22 but what the heck.
I'm gonna walk away from this one as a cup of tea is calling out my name... 👍
PS. Good to see MACD confirming this short.
This is based on price cutting below the -0.05% MA5. I would have liked price and MA5 to cross my DEMA22 but what the heck.
I'm gonna walk away from this one as a cup of tea is calling out my name... 👍
PS. Good to see MACD confirming this short.
Attachments
Atilla
Legendary member
- Messages
- 21,035
- Likes
- 4,206
Ok here is another on the 1 hour charts. Short @ 1.1085. SL @1.11
This is based on price cutting below the -0.05% MA5. I would have liked price and MA5 to cross my DEMA22 but what the heck.
I'm gonna walk away from this one as a cup of tea is calling out my name... 👍
PS. Good to see MACD confirming this short.
Just for the record stop gone taken out. Price currently 1.1098. Oh well. Interesting day tomorrow.
Hope to try 3Key system on the DOW tomorrow. See how it goes.
NN everyone...
counter_violent
Legendary member
- Messages
- 12,672
- Likes
- 3,787
If I'm allowed to make a suggestion. Just start posting charts with trades on them. That way it'll soon be clear if the method has potential or not.
Exactly....perhaps L M can wrestle the thread back and do a 10 series trades on the Dow ( 1 consistant intrument of choice would be preferable ) then we can all evaluate from that. Clearly labled and with a chart showing entry and stop.
If the series bears out his previous observations...then all is well, all tinkering and modifying before this is tested properly is a bit pointless IMVHO.
Good luck with it and lets hope it bears fruit.:clap:
regs cv
Wow, snap Splitlink. I've just seen your post after my last one and obviously we were thinking the same thing.
Hear what you saying about bottoms on the 1 hour it's flat and on my 4 hour it may be levelling out. Not the best of confirmations.
I wanted to test drive the 3Keys live see how it would go.
I've just seen my DEMA22 breached. MACD confirming rise. If I had balls of steel I'd go long. But I don't think I will.
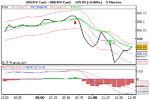
I seem to have made a mistake in the amount of move that was made. In fact, it was good for some points but nothing fantastic.
I'm not sure about yours, though. I like to see a HH/LL on the index and the reverse on the indicator, like my chart. Probably the fact that it was a 5' was the reason that there wasn't a great movement in it.
Attachments
Not necessary to trade in the direction of the sma no, the 15:00 bar did indeed wobble for a second but was ok, if it had indeed retraced on the trade this would be an ideal time to employ those tight stops, at no time was this trade in any danger of doing other than what it says on the tin and being a good 'un, there is no time to wait for the bar to draw, a lower timeframe would infact do this, I haven't got that far in my studies yet and thanks for the tips, cheers laptop 👍
LM, please can you clarify the direction of trade to take?
Is the direction determined by the previous bar (ie. the maket-shows-its-hand bar that extends beyond the upper and lower MA bands): if this is an up-bar, open a long trade when the price retraces down into the MA band; if a down-bar, open a short trade as the price retraces up into the MA band?
Don's decided to leave this thread but I understand that when you get the signal i.e. the close is above the upper channel limit (long trade), the next bar must open somewhere within the channel. If it does that, buy at the break of the top channel, or the top of the signal bar. However, if that bar opens below the channel, the trade is aborted.
Split
black bear
Guest
- Messages
- 1,303
- Likes
- 165
Sorry Don, no offense intended at all
Sorry Don, no offense intended at all
just trying to give you a couple of extra keys, should have asked 1st or thought... ye 😱 thought that would have been a good idea :idea:
sorry
see pm
Sorry Don, no offense intended at all
just trying to give you a couple of extra keys, should have asked 1st or thought... ye 😱 thought that would have been a good idea :idea:
sorry
see pm
Hi LM
you could use MT4 for charting this method you know. The MA's in MT4 have a shift available, and you can also decide whether to chart the high/low/close etc.
I recommend the alpari demo account.
excuse my ignorance, I work with VT TRader, how do you do the shift. Due you mean + - 5 pips or what?
Thanks,
Hammoud
welshandy1
Active member
- Messages
- 153
- Likes
- 0
this thread was doing so well, then just seemed to fade away before reaching any conclusions ... :-(
shame, was getting interesting!
shame, was getting interesting!
the_gipper
Newbie
- Messages
- 2
- Likes
- 0
Lightning McQueen - you still trade this.
I learned a lot from this one thread in general, but it seems to have just tapered off.
I learned a lot from this one thread in general, but it seems to have just tapered off.
Lightning McQueen
Moderator
- Messages
- 5,029
- Likes
- 841
Lightning McQueen - you still trade this.
I learned a lot from this one thread in general, but it seems to have just tapered off.
hi the_gipper
glad to hear you've found the thread useful, well i for one didn't feed the thread no more, so consequently if the contributors don't keep the thread fed it will wilt and die.
although i have moved things on a bit, truth be told i don't currently have anything further worthwhile to add to the discussions at this time, biggest issue being the trigger to reliably capture the move. but yes i'm indeed still working on things on and off as time allows. i do believe that it's worthwhile to do so as i can see that what i'm looking at hasn't change as far as chart history goes back, that's 80 years! that screams loud at me EDGE! 😀
mslcwt1
Junior member
- Messages
- 39
- Likes
- 2
LM,
Phew,
just got thru the thread and while it was laborious, I felt there was a system that warranted the effort.
I understand your diminishing input and also the effort.
Would it be possible, as a sort of final effort, to put in a rule listing as it stands now along with a recent chart with the 3 MAs showing entry and exit?
Maybe a sort of wrap up?
cedricthefrog
Junior member
- Messages
- 18
- Likes
- 2
Has anyone automated this system? What were the results like?
neil
Legendary member
- Messages
- 5,169
- Likes
- 754
Rooting around in the past
Useful stuff to be found in the cupboards of the past 🙂
The Set up rules and Chart
First we will set a chart up so you can see what's going on
1. Open an hour chart of FTSE
2. Set a 5 period simple moving average and set colour to blue
3. Set a 5 period simple moving average and set colour to red dotted move this average to a vertical shift of +0.05%
4. repeat 3 with a -0.05% vertical shift
thats the chart set
Rules of Trade Entry
basic trade entry is simply reading off the dotted line and entering this into an order on your trading platform
1. Longs are read off the top dotted line
2. Shorts are read off the bottom red dotted line
Stops The Important Bit
Stops are tight if the trade doesn't go our way from the off it is scratched straight away. close to zero as is possible if the trade doesn't run our way from the outset it will be real easy to spot if the trade is not right ...stop it out.
Some platforms allow naked no compulsory stops eg compulsory and IG (so they say ?)
Some have compulsory auto set stops like capital spreads
you will have plenty of time to set your stop away from the action this is recommended in case the platform goes down and is highly recommended as a disaster stop min distance away as allowed by the platform.
your main stop is is your mouse ...if in doubt stop it out!
Now the important part is out the way let' look at the nitty gritty of trade entry
there are two methods of taking the trade
1. take a directional trend trade based off the direction of the sma
2. let the market and its participants show its hand first then take a trade with them.
charts to follow showing examples which will show this simple method in action
and a trade taken on the ftse on the 2/1/08
all to follow shortly stay tuned
Useful stuff to be found in the cupboards of the past 🙂

