The Simplest Trading Method In The World

"Suzi is thrown in at the deep end, dealing with serious emergencies in A&E. Adam feels that he is not hands-on enough with patients and is frustrated by paperwork, while Lucy has to do her first rectal examination."

Your watching your friend Lucy doing her first rectal examination on BBC 3? Good lord, is this what they allow now after the watershed? I used to have to pay good money to see that kind of thing.

well you had to pay and I had to "volunteer".

want to swap?
 
buying 1296 for a bounce back to 1308 looks like a nice setup if it gets there tomorrow (or possibly thursday/friday depending on the action)

Agree - think the GDP/Durable Goods/Home Sales figures will do it - just not sure which day it'll happen and which figures. You've got support in roughly the same place on YM and 2300 on NQ all roughly happening at the same time. Should be like firing an elastic band. You never can tell though.
 
LULZ.

Here's the chart.
 

Attachments

  • US SPX 500 Daily Future (Mar (22-FEB-11).png
    US SPX 500 Daily Future (Mar (22-FEB-11).png
    23.1 KB · Views: 221
I couldn't see any confluence on the long either though - you sure you weren't boredom trading today :innocent:

It's not the greatest, but round number, minor s/r flip, nice bar (strong close, ok size). There was a pivot as well - s1 I think.
 
OK so program is finished ill show my graphs now. but like i said i dont trade sp500.

anyway, sorry to be rude but whoever said a pin from 5m graph is.... :/
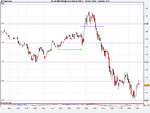
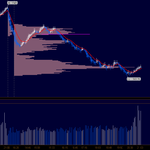
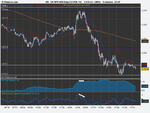
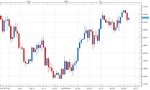
as well i will show something plain that is not said so far: the graph is of the es future, 3200 tick heikin ashi with volume profile underneath. there is as well a purple line.

now, i wasnt watching this real time so i dont have screenshots from then. but, a couple of things.

- look at the swings, it went like a 2B or ross hook (LOL) or whatever its called. Up then down then up but not as much and then down even more. why no one said short break of purple line i dont know.

- as well, look at volume lines on this graph. for the rest of the session, this much volume was only done near the close (which is normal in es). but if you imagine that from the gap down, not that much volume would have been done as wre done at the highs, you know what i mean? at the time it was at the highs, you would have seen from the profile that alot of volume was being done (what i mean is you wouldnt have known they were the highs. but i said it before for me big volumes in chop trade are signs for new trends!)

- last thing... there is like civil war in libya and there is problems even in yemen by then and gudaffi saying "shoot all the drunk dogs" and whatever. and stock exchanges were closed when it was all going on. selling stocks when this happens will not be the most stupid thing you ever do in trading ://

i know there is bikini already so i wont show more (i have better taste than you anyway) but because i have maybe said 5m pins are stupid i will (honestly) tell you that i have actually ended up in a&e and actually had a student doctor put her finger up my bum.

troof.
 

Attachments

  • bumgraph.PNG
    bumgraph.PNG
    34.9 KB · Views: 249
by the way in case you dont have tick charts the breal below the pruplr line was just after 4 o clock so it isnt incorporated in the pin that was mentioned.

as well i should say that there wasnt really any "conflunece" at that point of turning... i mean you can see them if you look after it happened, but honestly at the time i wouldnt have that area marked out as anything special.

I agree - all I could see was an interesting drop in momentum as the rally died. The level meant nothing though, the price action didn't say anything to me and there was no increase in volatility so I would never have taken this one. Nothing shows up on 5M or 15M on ES or 15M on NQ or YM. It would have been a punt for me.

But Jimmy, yeah Jimmy, he knows like you and I don't know Dash.........
 

Attachments

  • US SPX 500 Daily (22-FEB-11).png
    US SPX 500 Daily (22-FEB-11).png
    19.7 KB · Views: 231
Last edited:
close of week friday cable was running into major S/R I took the trade short this week and exited in 2 stages, 36 pips on first half and 82 on second. Called them live over on the live calls thread.
So far S/R is the only thing that has worked for me...
As I am at work will post a pic later :cheesy:
 

Attachments

  • cable.jpg
    cable.jpg
    76.8 KB · Views: 227
  • outcome.jpg
    outcome.jpg
    71.2 KB · Views: 240
obligatory pic of babe after posting chart.:)
 

Attachments

  • Irina_Shayk-008.jpg
    Irina_Shayk-008.jpg
    21.3 KB · Views: 277
This pic is out of a Kay's catalogue! At least turn to the swimwear section!

This thread is no place for tasteful pictures of well dressed women! :cool:

That's right, it is a place for pictures of the elderly playing with Wii's

wii_sun.jpg
 
Last edited:
This pic is out of a Kay's catalogue! At least turn to the swimwear section!

This thread is no place for tasteful pictures of well dressed women! :cool:
duly noted, don't worry it was an uncharacteristic display of moderation. Won't happen again:p
 
Last edited:
Top