That's really interesting - thanks. I try to follow the sparse but valuable nuggets that Pazienza scatters around. If you are listening Pazienza, people are still interested 👍
Very kind of you to say so, but there is so little to it there's not a lot of point in me posting any more.
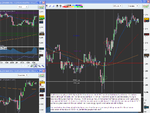
That said, since you asked here is a pretty nice chart that illustrates two solid set ups.
First thing, this is TF - mini Russell futures. Stock indices often tend to be very trendy intra-day. The recent moves have been extreme, but on a day by day view they're only really unusual in scale and the fact that the direction has been pretty constantly one way.
Anyway, to the left of the chart we were already heading down. It bounced around the 800 mark, dipped through, popped up, and then just kind of hung around. Then we got the 1st of August. Notice the little double top (green circles).
Set up 1 is pretty conventional, a bearish outside or engulfing bar. Price tested high then reversed sharply. What is different about this is - well just look at it. First, it is huge. Second, look how it engulfs - not one or two bars, but a large range. Then look how it closes - it closes strong, and below (if only just) the round number.
Now look at the area - 800, and an area of significance. See how price pivots around it.
So, you've got a story - downtrend, temporarily suspended, and you're trading south so in the direction of the recent trend. You've allowed price to convincingly test higher (forming a little double top), and waited for the rejection.
You've got a good area - big round number, price pivot.
Then you've got absolutely classic, screaming in yer lugoles price action. This is not some sh1tty, ambiguous little thing. This is a big, beautiful ba$tard. If you've been getting f***ed on the PA element of your trading, look at the crappy little bars you've been taking. Then look at this beast. Get it?
Wait for the good ones. Motherf***er.
Now look at how the trade went. You would have been in a drawdown for about 1 minute. Do you like trades that are easy to manage, or do you like trades where you're on one ar$e cheek for the next seven hours?
Think about why this might have had a higher likelihood of working, and working well. And think how the market communicates this too you in many different ways.
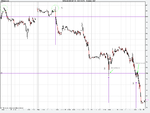
OK, next one (number 2). Price basically drops out, only pausing overnight as usual. Where does it bounce? 750. Now look at the bounce. It's kind of a hammer / pin bar / whatever - a reversal signal. But look how crappy it is. OK, size, but weak close (some people pay no attention to the close, but for me it's important, and yes I know it's arbitrary etc etc).
Now, we're looking to be in a solid down turn by now. When you play a break of the bottom of the crappy reversal bar, you're also playing a break of the big round number. If you missed it, how about the crappy little pin at 3? Look what happens after that pin - yes it reverses, but only to test back to what? 750. Then it craps out again in earnest.
Again, look how easy it is to manage.
Remember, these are just pictures. But they represent something very important. Go and read "How to Trade in Stocks" and think about the concept of the Pivotal Point. What does it mean when we see action like this?
You are NOT looking at candles, pins, round numbers, support and resistance, double tops and anything else I might have refereed to above. These do not exist, they are not real. You are looking at a market. The ONLY thing that is real is price. EVERYTHING else is a fiction.
It really is simple. Just be patient and wait. Make it easy for yourself.
Don't forget. Price action does not work. Round numbers do not work. Support and resistance does not work. NOTHING WORKS. Learn to read the story that the market is telling you. Think about that, understand what it means, and you're well on your way.
Anyway, hope that's been useful.


