Best Thread The Basics of Trading

Hi All,

I have never been able to interpret volume successfully. To the point where I do not use it these days. I read in the Feb SFO (an interesting read, by the way) that a spike accompanied by high volume was a good indication that the market was telling me to sell (it was a buying spike). I have taken advantage of the charts on this thread to look at the spikes. They all reversed with good selling opportunities but the volume on all the ones that I examined were low- some very low.

I have seen the market rising with high, medium and low volume.
Falling with high, medium and low volume.
Peaking and bottoming with high, medium and low volume.

Divergence does not help me, either. The market seems to peak in volume halfway up the rise. A student of volume theory could get a signal on the next peak with lower volume, only to see one or two more peaks with even lower volume before the reverse finally comes.

Any comments welcome, please.

Split
 
I have never been able to interpret volume successfully. To the point where I do not use it these days.
and:
I have seen the market rising with high, medium and low volume.
Falling with high, medium and low volume.
Peaking and bottoming with high, medium and low volume.
I use volume a lot as a confirming signal for a break of support or resistance. Its especially useful for breaks out of a rangebound situation. If you think about the logic, then the following should apply:

If a break of S/R occurs on low volume, the likilihood that its a false breakout must be higher - simply because the energy behind the move as shown by the volume figure is poor. Even a large move will often fall back just as quickly under these conditions. Conversely, high volume suggest a stronger momentum which is more likely to carry matters beyond that level.

However, a breakout on low volume will sometimes succeed, so what is needed in order to enter the market is a further confirming signal. I tend to require at least one close above the s/r level before committing myself. Two if i think more caution is need.

HTH
 
Volume is a tricky subject! Maybe our resident expert Skim will respond, albeit wrt ES Futures only. I find that it can be deceptive to try and use it to trade. If you use it as a confirmation tool, you will likely do better. I think in a "true" situation, i.e. one that is not being manipulated by the MM's, there are clear cut signs.
Example. watching closely on the ES futures 1 min. you often see the volume slowly dry up from 1500/min down to one or two hundred/min ( doesn't matter if it's up or down ticks or mixture) This invariable leads to a decent move on the price. Getting the direction right is another matter. ES Futs. also respond to divergent volume peaks.- See my ES vol charts.
Hope this helps.
 
Hi Les and Chartman,

Thanks a lot for your interest. Les, I have done some backtracking on ES futures and am as mystified as ever! It does, as Chartman says, confirm, but that, to my way of thinking, is hindsight. It should work but, in my case, maybe I should leave it alone. The trouble is that I am always looking for an improvement to my trading and will keep going back to double check things.

One minute trading? Mmm! Five minute stuff is hairy enough for me! I have noticed that the volume peaks and rapidly falls away
but, as you say, which way do we trade? Not much of a clue there for me to see. Never mind, I'm still in the game after many years so I must be doing something right.

Regards Split
 
Volume?

I find volume very useful as a confirming item : mainly for tops and bottoms.. or for indications of trend size:

I run a scan:
Volume = MAX(VOL,50)
or
Volume +Volume.1 >1.95*(MAX(VOL,50).
(which says volume in this bar is the highest of the last 50 or the volume in this and the last bar combined is > 97.5% of the high of the past 50 bars)

and show the result as a yellow triangle in the chart.....it clearly confirms the top in RS 3 min chart at 852.5 and 19.25pm and the low at 845.3 20.30-20.45pm
 

Attachments

  • volume.gif
    volume.gif
    236 KB · Views: 1,228
Re: Setting Price Targets

FTSE Beater said:
Hi all

Thank you to iSquared for giving me the idea to do this.

....<snip>....

The text books say that the more often a level is tested and the longer the period it is tested over, the stronger it becomes. As Mr.Charts has pointed out in another thread, this isn’t strictly the case for there are complex reasons why it doesn’t always work, but as a guide I think it’s reasonable to assume the longer a support / resistance level holds the stronger it is.


Mark,

No problem with the idea. I'm sure you would have covered it in due course.

Now to diverge into semantics :eek: rather than use 'stronger' why not change it to 'significant'. That is the more times S/R are tested the more significant they are when they fail. A failure is of special interest as at that point there is a significant change in the supply/demand balance and that will eventually happen. The more times they are tested the more likely they are to fail or everything would be forever rangebound.

Cheers,

Andrew
 
Volume is a wonderful indicator - yet one that very few people use. Take a look in any TA book and see how much is devoted to volume; very little indeed. There's more written about OBV (on balance volume) than on volume itself.

It does take a lot of practice to be able to 'read' volume, but when you can it is magical. As I trade just ES intraday, my knowledge of volume on EOD charts is limited, although theoretically you should be able to read it as you do on intraday charts.

Those volume bars tell a whole story, from the introduction to the end. It's like a book really, with events and set-ups before you get to the final chapter. If push came to shove I'm sure I could trade very profitably off just a volume chart, with no prices. However, volume does not show you direction; just the events unfolding as you make your way through the book.

Last year I used to trade ES off the 1 minute chart (I don't any more), and in a bull or bear trend it was fantastic to watch the volume predict the breakout of pennants and flag formations.

I used to watch the volume of contracts tick up and time them - at 15 seconds into the one minute bar just multiply the number of contracts x4 to give you an approximation for the end of the bar, and you'll have an idea if the volume for that bar is likely to be double or more of the previous bar. During pennants, flags and triangles on the one minute chart, volume literally dries up (all the traders are sitting out waiting for it to break out).

However, by timing the volume you can tell during the first 15 seconds of the one minute bar if it is going to be 'the' breakout bar. This indicates before the price, and 9 times out of 10 I could get in before the SB companies changed the bias.
 
Setting Price Targets

Hullo again FTSE Beater.

A coupe of days ago, you suggested we have a look at setting some price targets. As you know (I think) that I’m pretty new to this, then be please gentle ;-)

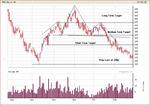
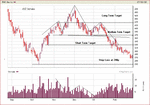
If I’ve followed your instructions correctly, here’s the chart

Subject : Amvescap

My 'trade' should begin with how much I can lose:-
Stop Loss first : 240p

And now on the upside...
Short Term target :330p
R/R 1.25

Medium Term target : 375p
R/R 2.4

Longer Term target : 435p
R/R 3.9

The targets are ‘round’ numbers, based on support and resistance only (I’m still reading about secondary indicators at the moment) and have been picked on examination previous levels of S/R (in last 6 months).

Time scales – finding this a tricky one. With a prevailing wind, it looks like the Longer Term target of 435p could be met in 6 weeks.

If the share began to rise, would you advocate a rising stop loss, locking in / keeping constant the R/R e.g. say aim for 375p, keep moving stop loss up to maintain R/R of 2.4?

Cheers and look forward to where I’ve gone wrong !

SoldierofOne
 

Attachments

  • avz 27.02.03.bmp
    400.1 KB · Views: 630
Hi SoldierOfOne

Superb chart :)
The only other thing I can see is an even longer target at 500 - but yet again that comes down to time-scales
If the share began to rise, would you advocate a rising stop loss, locking in / keeping constant the R/R e.g. say aim for 375p, keep moving stop loss up to maintain R/R of 2.4?
Yes I would, as Skim has said in another post, lock in profits and keeping about a 2.4 RR is great. It doesn't have to be 2.4 but SHOULD be better than 1:1.

Hope this helps and take care :)
 
FTSE Beater said:
Hi SoldierOfOne

Superb chart :)
The only other thing I can see is an even longer target at 500 - but yet again that comes down to time-scalesYes I would, as Skim has said in another post, lock in profits and keeping about a 2.4 RR is great. It doesn't have to be 2.4 but SHOULD be better than 1:1.

Hi FTSEBeater

With regard to Soldier's AVZ chart: :confused:

1) I see a H & S with a neckline that has been tested at beginning of Feb at 360 (give or take a few for the badly drawn lines). Surely this has indicated a reversal from the high at 500?

2) If this is so then is a target for the downtrend is likely to be 250?

3) Is this a good bet when there are no signals to show a reversal of the down trend yet? Would it not be better to wait and see before making a move?
 
Hi NastyItch

Thanks for your comments – this has made me look at the chart again.

Here are my thoughts:-

So, we are looking at a slightly falling h + s neckline (I missed this). As I understand it, the price reversal after the h+s should at least equal the difference between the neckline and the head.

If the head is at 505p and the neckline at 375p, then we are looking at fall of 130p to 245p before upward movement is seen again? Is this what you are saying, NastyItch (forgive me, I’m at the stage where I have to think everything through longhand !)?

If this is so, and one was looking to trade, would it be best to wait and see if 245p was tested and became support (go long) or the price action continued to fall (stay on sidelines and watch some more?)

One more point – volume

Again from reading, I understand the volume associated with the rally leading to the right hand shoulder is supposed to be weaker than the volume associated with the fall of the right shoulder (completing the h+s).

This looks to be the case here with AVZ, or am I seeing things ?

Look forward to more comments – cheers, NastyItch, I’ve learnt some more (I think!) from this exercise.

SoldierofOne
 
Hi NastyItch

Well spotted on the H&S. :)

At this point the H&S has pretty much run it's course and is coming up to it's target.
This wouldn't signify a long at this point, as there is nothing to say that the price will go up from here.
 
Hi FB,

Posted By FTSEBeater:
"This wouldn't signify a long at this point, as there is nothing to say that the price will go up from here."

If there is nothing to say that the price will go up why would you want to go Long ?


Paul
 
Hi Soldier

Yes, that is exactly what I was getting at. The volumes do seem to confirm the H & S reversal with a target of around 255.
At this stage I am concentrating on learning to identify the trends, S & R and various patterns.

However ...

FB and Trader333

My next step would be to learn how to intepret the stuff mentioned above. So thanks for your comments. BUT...

If "there is nothing to say that the price will go up from here." then why go long (agreed), but likewise I don't see anything to say the price will continue to drop.

At this stage I am thinking, look at a longer timeframe chart. In the next post is a 3 year view which clearly still shows a downtrend. If I was asked what I would do, I would wait and see, although there may be a tendency to go short.

BIG QUESTION for the experienced folks out there.
If I were to do intraday trading what timeframe charts should I be looking at using?
What about trading on a weekly and a monthly basis?

Cheers
 

Attachments

  • avz3rd take.gif
    avz3rd take.gif
    18.8 KB · Views: 952
Hi FB

Glad to hear you are back, your deepest apologies are not necessary. What do they say about 'presence not presents' are more important (although presents should not be turned away) :D

Earlier in this thread I had answered Soldier and posed some questions I was hoping you would pick up on.

BIG QUESTION for the experienced folks out there.
If I were to do intraday trading what timeframe charts should I be looking at using?
What about trading on a weekly and a monthly basis?


Just a thought ;)
 
Hi FB,

So far been a very informative thread on the basics, keep it up :)

Keeping in line with basic and perhaps a step onto TA a suggestion to explain a favourite of mine, Pivot Points, maybe worthwile. This could encorporate the knowledge base of your teaching on support and resistance with a method of trading. Another advantage would be that you could demonstrate the other aspects that you have covered, such as money management for example, relavent to this form of Sup&Res
Just a suggestion and seems a logical progresion if you were considering moving onto more complex indicators in the future
 
NastyItch said:
Hi FB

BIG QUESTION for the experienced folks out there.
If I were to do intraday trading what timeframe charts should I be looking at using?
What about trading on a weekly and a monthly basis?


No matter what time frame you are trading over it is worth looking at the 10 year and 5 year charts on a weekly basis and the 1 & 2 year charts on a daily (or night before) basis. This should make sure that you at least know the major levels in the charts.

For actively trading intraday 1 minute bar (or candle if you prefer) charts - some also keep 3 and 15 minute charts running for reference.

For weekly/monthly trading 1 & 2 year charts.

HTH
 
Hi FTSEBeater
Welcome back. Appreciate the effort that you are putting in.

Along with others, I'm busy trying to look at charts based on what we have gone through so far.

Looking forward, here are a couple of suggestions on the 'supporting cast' (by which I assume you mean 'indicators'):-

1. moving averages (advantages / disadvantages of SMA and EMA; what periods do you look at? 5 day, 10 day...200 day? Do you have a preferred moving average/combination and then cross reference with another one?)

2. MACD and Signal Line (as above; do you use 13 and 26 day or something else?)

3. RSI

4. Volume

Look forward to the next instalment

Cheers

SoldierofOne
 
Top