Technical FOREX analyses by IVT

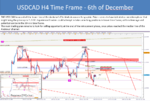
7th of December - USDCAD

A breakout to the downside of the range have initiated a strong bullish move. This new situation might give a nice opportunity to short the USDCAD in the upper part of the range. We need to wait for a bearish price action before to enter the market. No selling opportunities for the moment, I will keep your informed.
 

Attachments

  • 6_USDCAD.PNG
    6_USDCAD.PNG
    184 KB · Views: 603
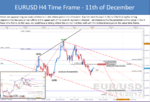
11th of December - EUR USD - bullish bias before a reverse

Last Friday the NFP data came out greater than expected (228K people employed). Congress voted Thursday to pass a bill that would extend government funding by two weeks. In this way, a partial US government shutdown was avoided on Friday pending signature by the president.


Prices are approaching our main resistance cluster where prices should reverse. If prices were to reach 1.18, I will be looking for selling opportunities because prices will be in the upper part of the bearish regression channel. I am interested by the potential combo setup in the 4-hour time frame. In this case, we could have a timing where the combo matches well with the technical analyses in the same time frame.
 

Attachments

  • 2_EURUSD.PNG
    2_EURUSD.PNG
    176.6 KB · Views: 265
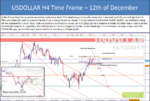
US DOLLAR - 12th of December

In the 4-hour time frame, prices are below a resistance level. This detailed graphic is a bit dense, but if you look carefully you will see that the
Fibonacci expansion and retracement levels show a strong resistance cluster. If prices were to break below 12,000-12,010, our Andrews’s setup
will be activated for a short trade. I will not send any notifications, as we use the USDOLLAR as a compass to trade the other major pairs such the
AUDUSD (looking for a long trade), the USDCAD (short trade in progress) and the USDJPY (looking for a short trade). If some of you trade the
USDOLLAR, you use the Fibonacci levels (written in red) for your Target profit.
 

Attachments

  • 1_USDollar.PNG
    1_USDollar.PNG
    204.2 KB · Views: 270
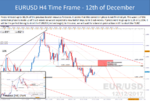
EURUSD - 12th of December

Prices retraced up to 38.2% of the previous bearish move as foreseen. It seems that this correction phase is not finished yet. The wave 1 of this
correction phase is made up of 5 sub-waves so we are expected a new bullish impulse in 5 sub-waves. If prices were to go up to 1.18 or 1.1834, it
will be the perfect timing to short the EURUSD (red rectangle). In this case, we will wait for a bearish price action in H1 to short the EURO
 

Attachments

  • 2_EURUSD.PNG
    2_EURUSD.PNG
    188.4 KB · Views: 294
GBPJPY : A swing short opportunity to come - 08/03/2018

In the monthly time frame, the EUR/USD seems to have completed a wave 2 (green). This statement means that prices are expected to build a bearish impulsive move (wave 3 green).

In the weekly timeframe, prices seem to have built the sub-wave 1 and 2 of the expected wave 3, so the GBPJPY could be building the sub-wave 3 (orange) of a wave 3 (green). However, prices have only retraced up to 50% of the previous bearish move, so the market might go higher up to 168.33 (red rectangle).

In the daily time frame, it is difficult to know if the sub-wave 3 (blue has been completed). Prices are currently testing the upper line of a downward channel. If prices break above the trendline and the resistance level (grey line), it will make the most sense to look for buying opportunities.

To sum up, on the long-term, we are looking for an entry point to sell the GBPJPY, but in the medium-term, it makes the most sense to look for buying opportunities. However, if an opportunity to short the market comes up, a notification will be sent to all our VIP members.
 

Attachments

  • 2018_03_07_GBPJPY.png
    2018_03_07_GBPJPY.png
    931.7 KB · Views: 307
Top