TDs Journal

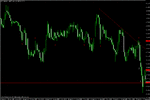
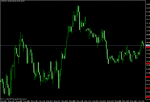
I had a feeling that the Dollar/Canadian cross was going to break down today. The weekly TF is showing several consecutive pin bars.

There was considerable support at around 1.0575 and as always what I wanted to do was get in well above this so that I could put some distance between my entry and any bounce that may occur.

I followed the price up for most of the day, waiting for the optimum entry, before seeing the failed break of the descending hourly TL and the rejection of an s/r pivot, resulting in an inside bar.

When I saw this, I put my order into sell £3 at point 1.

Price then went straight down, holding only briefly at support.

I had several targets on the way down based on the daily TF (the red lines on the chart). I decided to take £1 out at point 2 which was the first target. This was a significant pivot on the daily and I know this pair can be very choppy so as soon as I had one unit out and I noticed the price stalling, I covered another £1 too.

I then rode the final third down to point 3, where I exited with a limit order.

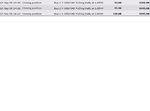
Total profit on the trade was £319.
 

Attachments

  • usd_cad_hourly.gif
    usd_cad_hourly.gif
    21.8 KB · Views: 452
  • Account_Summary.JPG
    Account_Summary.JPG
    18.8 KB · Views: 338
Last edited:
wow! at this rate TD, very soon we will be looking at a 1M GBP account balance :clap:


I had a feeling that the Dollar/Canadian cross was going to break down today. The weekly TF is showing several consecutive pin bars.

There was considerable support at 1.0575 and as always what I wanted to do was get in well above this so that I could put some distance between my entry and any bounce that may occur.

I followed the price up for most of the day, waiting for the optimum entry, before seeing the failed break of the descending hourly TL and the rejection of an s/r pivot, resulting in an inside bar.

When I saw this, I put my order into sell £3 at point 1.

Price then went straight down, holding only briefly at support.

I had several targets on the way down based on the daily TF (the red lines on the chart). I decided to take £1 out at point 2 which was the first target. This was a significant pivot on the daily and I know this pair can be very choppy so as soon as I had one unit out and I noticed the price stalling, I covered another £1 too.

I then rode the final third down to point 3, where I exited with a limit order.

Total profit on the trade was £319.
 
Hi MrGecko, thanks for reading my journal.

Rather than take a view, I try and follow the price and stay open to all eventualities.

However, I can say that price has held above the confluence of a rising TL and a previous major swing low so there is support. While we are above support and a strong one such as this, I am looking to be a buyer.

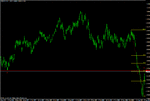
Interestingly, price has hit what was my first target in the trade I took, head on (see chart attached) and found some resistance...

At each resistance level on the way up, I will be looking for shorts into the downwards trend that started in June...


Hi mate. Just looking at the beans, it's quite difficult at times to buy a selling market, less clarity for the buy side as opposed to finding a decent sell price. Are you selling the 150 area now. Good trading mate.
 
Hi mate. Just looking at the beans, it's quite difficult at times to buy a selling market, less clarity for the buy side as opposed to finding a decent sell price. Are you selling the 150 area now. Good trading mate.

I am not currently considering a position in this market but I will continue to watch it.

The best way to describe what I will do in the future is:

i) Keep an eye on the path of least resistance.

ii) look to cover longs or go short at resistance.

iii) look to cover shorts or go long at support.
 
I am not currently considering a position in this market but I will continue to watch it.

The best way to describe what I will do in the future is:

i) Keep an eye on the path of least resistance.

ii) look to cover longs or go short at resistance.

iii) look to cover shorts or go long at support.


Nice journal, TD.
 
TD
Excellent CAD trade! Just goes to show how strong the signal can be on the inside bar combined with TLs and significant SR.
Good trading,
Grim
 
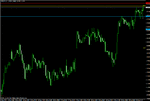
There was a good level on the Cable which the market seemed unable to break to the upside. (see chart 1)

The market was clearly rangebound but the level was a good one so I decided to sell it at point 1 (chart 2).

Having sold £2 per tick, I was actually aiming to get half out at the first support (point 2) and leave half to run but I was in the process of moving the computer screens at my desk around when it broke rather sharply and wasn't concentrating on it.

Having seen it hit the support and just as quickly retrace, I moved my stop to breakeven and came out for a scratch.
 

Attachments

  • pound_daily.gif
    pound_daily.gif
    24.1 KB · Views: 389
  • pound_hourly.gif
    pound_hourly.gif
    25 KB · Views: 380
  • Account_Summary.jpg
    Account_Summary.jpg
    11.5 KB · Views: 293
I am not currently considering a position in this market but I will continue to watch it.

The best way to describe what I will do in the future is:

i) Keep an eye on the path of least resistance.

ii) look to cover longs or go short at resistance.

iii) look to cover shorts or go long at support.


See the beans went through 150, did you get on it?
 
Hi TD,

I've never quite understood this phrase. Read it many a time in 'Reminisces..' but if you could enlighten me that would be great. (y)

Porph,

A good description of the path of least resistance can be found in Bill Williams' "New Trading Dimensions: How to Profit from Chaos in Stocks, Bonds, and Commodities.

Williams quotes Robert Fritz's book "The Path of Least Resistance" in the excerpt below:

1. Everything in the universe follows the path of least resistance. The markets are like a river. As they move through each minute, they take the path of least resistance...While a river is running downstream, the path of least resistance determines its behaviour. Gravity is energizing it as it flows around rocks and along curves in the riverbed.

2. The path of least resistance is determined by an always underlying and usually unseen structure. The behaviour of a river, whether it is calmly flowing downhill or creating rapids, depends on the underlying structure of the riverbed. If the riverbed is deep and wide, the river will flow calmly downhill. If the riverbed is shallow and narrow, the riverbed will create rapids. The behaviour of the river can be accurately predicted by examining the underlying riverbed.
 
Yesterday marked the end of my third week trading this account.

I went short £2 of Usd/Jpy at point 1 on the hourly TF after the S/R pivot was rejected and a pin bar formed.

First target (support) was hit but I decided to hold the full position and add more on a possible breakout rather than get some out...and it came right back and stopped me out for breakeven.

It's examples like this that people always point to when they say "take some profit off the table" and I have been doing that at times but a trader has to make a judgement call each time, based not on the desire to secure profit but rather by weighing the probabilities of a continuation against that of a reversal. I can't count the number of times I've reduced my position or even lost it altogether, just before a huge move.

In this case I got it wrong.

So, another scratch (these are close to making up the majority of my outcomes).

In the three weeks so far, I have made 20 trades in total:

10 Wins
2 Loss
8 Scratches

The intial £40.60 is now at £1,593.50.

I am currently holding an open position in the equity cash market but I will document the outcome of that when I close it. You can see the interest rate charges in the statement below.
 

Attachments

  • usd_jpy_hourly.gif
    usd_jpy_hourly.gif
    26.9 KB · Views: 322
  • Account_Summary.jpg
    Account_Summary.jpg
    17.7 KB · Views: 319
A question for Trader Dante if I may...

Could you (or have you already, if so, where?) provide a list of the price signals that you use with a brief description of how you would trade each one? This thread is fascinating and I'd like to do something similar. I stopped trading (spread betting) a while back because my head was all over the place and I had become paralysed with confusion and fear of losses. I want to get back into it but I want to do so with a very clear idea of what I'm going to do, and how, so I don't lose the plot again.
 
Top