Swing trading FTSE100 members

hi all
i am looking for Traders who trade Indices. i want them to manage some of our accounts we can discuss a % profit on the account. please let me know.
 
Short SSE triggered today and just avoided being stopped out. No longs stopped out yet.

No new signals for 08/02.
 
BSkyB short stopped out at initial stop. Intertek long trailing stop hit for nice gain (3 x BSkyB loss).

Will post up potential swing trades for tomorrow later.
 
No obvious new trade opportunities visible for tomorrow using 3-day retracement patterns.
 
Do you find that there are always trading opportunities with this approach or do you have to wait for specific market conditions?
 
PS - Technically, Astrazeneca was a buy today, as price breached the high of swing low 3010.0, 03/02. However, the drop from entry to initial stop, 94p (3.1%) just too great for a sensib le position size for me.
 
Do you find that there are always trading opportunities with this approach or do you have to wait for specific market conditions?


The opportunities tend to rhyme with the pattern of the main index. So there are fewer entries signalled while the market is ranging, which is what we all want to avoid anyway, and more appear once we're in a trend. A key element is to get confirmation of the trend before setting orders based on recent price action: I suggest 3 progressively higher swing lows before entering long but if you're aggressive, you could jump in after just 2.
 
Makes sense, thanks.

I am new to swing trading, but I have noticed that the first swing following a break out seems to have a high probability of success.
 
No less tha 6 putative swing lows formed in uptrends today, though some are only second successive higher swing lows rather than third. Also, 3 of these potential longs for tomorrow are miners - not sure if anyone's trading portfolio needs 3 miners to trigger buy orders on the same day. Of those 3, BHP billiton has only a chart with only 2 successive higher swing lows so might be the weakest of the 3 -
BHP Billiton
Glencore International
International Power
Intertek Group
Rexam
Rio Tinto
 
Good crop of putative swing lows for tomorrow's session but note how many Miners. As previously, not sure if anyone's trading portfolio needs a full set of Miners -
Antofagasta
BHP Billiton
BT
Capital Shopping Centres
Eurasian Natural Resources Corporation
Evraz
GlaxoSmithKline
Glencore International
International Consolidated Airlines Group
Intertek Group
Polymetal International
Rio Tinto
Vedanta Resources

1 putative swing high, BSkyB, as potential short.
 
PS - Technically, Astrazeneca was a buy today, as price breached the high of swing low 3010.0, 03/02. However, the drop from entry to initial stop, 94p (3.1%) just too great for a sensib le position size for me.

Tomo

Sorry to be late in the game here, but I've been away for a couple of weeks soaking up a bit of sun (courtesy of the swings :)). I'm particularly interested in what you're trying since it's basically my main thing and has been for thirty years and more.

I see you're following Rivalland but I'm a bit thrown by some of those you have mentioned (although haven't looked at them all in any detail). This AZN one, for example - any chance of posting a chart so I can see where you're coming from?

Interested, too, in how you're deciding you have a trend to work with. Also exits - you might test out limit exits at previous high (low) of the trend and re-entry strategy if it doesn't stop.

The other bit that made me chuckle was the number of opportunities being thrown up - like London buses, it's often feast or famine :LOL:

I think you've perhaps got to be a bit more sophisticated with your filters.

jon
 
Welcome back jon, and your input has to be welcome on any thread on swing trading.

I'm starting with minimal TA and subjective input but am open to enhance the method, that's the idea of putting this up on the site.

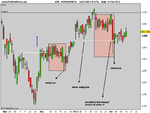
AZN isn't the clearest of charts, but therefore not a bad opportunity perhaps for some explanation. The HL bar chart shows swing lows 25/11 and progressively higher at 20/12 and 03/02. In between are swing highs also pointing higher, 07/12 and 18/01: there is even an earlier, lower swing high at 15/11.

Friday 03/02 made a convincing but still putative swing low, offering the chance to go long into the uptrend on its breach at 3010.0 on Monday 06/02. Actually, the breach did not materialise until Wed 08/02 and follow-through has been absent. Using ATR of the previous 5 sessions, including the swing day but excluding inside bars, gives an initial stop 94.0 below 3010.0. Clearly, the position needs to be sized according to the depth of the initial stop, rtaher than just use a set £ per point entry regardless of the share price, be it 3,000p or 30p, but I don't need to take any trades with ain initial stop 3% below entry.

I'm using ATR5 instead of the other end of the swing bar for now, as it eliminates the extremely short or long stops that a single session can generate. As far as s/r levels are concerned, if I could consistently predict price reaction to these, I wouldn't be swing trading a la Rivalland, plus there is an element of subectiveness in the art of picking the right s/r levels which I want to exclude at least for now.

On trend, although we will probably agree on direction, strength, i.e. probability of continuation, is a lot harder to distinguish between two charts, so I'm not trying too hard to do this for now.

Yes, some sessions will end with no putative swing bars, some with a lot, but this tendency will generally respond to the index: if the 100 has made an uptrend and retraced moderately for 3 days, there will be plenty of chances to get long, and that's what I want. If the 100 tiddles sideways, up and down for just 1 or 2 days at a time, I want to be out of the market.

More from me later when I've downloaded the day's action.
Tomo

Hope you don't mind a few comments.

1. The context is important. You are looking for a retracement which comes from a pause in buying interest combined with profit taking. At best you want to see this in consecutive bars of lower highs and lows, but it must look like retracement and not consolidation. Thus it should not take more than four or five bars before a swing low is reached and the retracement should always take significantly fewer bars than the up move to high where retracement started.

2. So far as AZN is concerned you'd be a bit hard pressed to see a convincing trend via the weekly, but we'll assume the up break of earlier swing high (blue arrow)gave you an up change. What happens then is consolidation with the swing low merely the low point of it which took much longer to arrive than the up move to the high - yes, it would have "worked" if you traded it but that's life :)

3. Anyway, onward and upward but where does it stall - at around 3100 which was an earlier high. If you'd been in a trade you'd run here since double tops are dangerous in that a major reversal is on the cards.

4. We retreat some but it's consolidation mode again until that long red, much bigger than any other on the page and presumably in reaction to their annual report (they go ex-div tomorrow). Such a candle is very dangerous to regard as part of a retracement. At best, you want to see them modest and reducing in range.

5. The next candle gave you your swing low (it didn't on my feed). Again it might "work" but the surrounding circumstances are not on for me and it's taking too long to get going. We'll see.


Just some thoughts

jon
 

Attachments

  • ASTRAZENECA.png
    ASTRAZENECA.png
    10.8 KB · Views: 231
Cheers for this message jon. Taking your points as you have numbered them -

1. Yes, well explained. I should be logging the sessions in the trend and retracement legs.

2. AZN is a messy chart (I didn't take this trade). I do hear traders say multiple time frames are good to cross-check a trend is real and not noise. Not entirely convinced - how many time frames are enough? But I am hoping to filter for the best swingers so this might be a way of doing that.

3. A swing low in an uptrend will always run back towards a previous high. Trying out Capital Spreads' trailing stops to get me out alive.

4. Agree on that.

5. Yes, it's a poor chart pattern and probably not worth the risk. But I'm hoping with a hundred shares to pick from I should do better than I used to do just trading the index alone!
 
Putative swing lows to consider for long positions tomorrow, some of these date back to earlier set-ups -
Aviva
Burberry
Glencore International
International Consolidated Airlines Group
Kazakhmys
Lloyds Banking Group
Prudential
Resolution
Rexam
Rio Tinto
Vedanta Resources
Xstrata
 
Cheers for this message jon. Taking your points as you have numbered them -

1. Yes, well explained. I should be logging the sessions in the trend and retracement legs.

2. AZN is a messy chart (I didn't take this trade). I do hear traders say multiple time frames are good to cross-check a trend is real and not noise. Not entirely convinced - how many time frames are enough? But I am hoping to filter for the best swingers so this might be a way of doing that.

3. A swing low in an uptrend will always run back towards a previous high. Trying out Capital Spreads' trailing stops to get me out alive.

4. Agree on that.

5. Yes, it's a poor chart pattern and probably not worth the risk. But I'm hoping with a hundred shares to pick from I should do better than I used to do just trading the index alone!


tomo

Doesn't Rivalland wait for a solid swing high(low) breach to signal change of swing trend? It's ok but often far away and you can sort out something else to get you in nearer the start of a potential new swing trend. I tend to think in traffic lights - one pops on to suggest a change, then another to give some sort of confirmation, then another and so on. How many lights you want lit before you're happy is personal taste. You might find find a couple of MAs helpful, I dunno, 20 and 10 maybe. It's particularly important for me to see a strong trend since I will often hedge with ftse in preference to a stoploss, so if I'm long I want the share that's likely to outperform ftse whether or not it's going up or down.

You'll find some shares are better than others for well ordered swings - I've got around 15 in my favourites stable although I'll chance others as well having treated them with much more suspicion. Be choosy.

Of the shares you have listed only lloy, av and pru have interest for me atm.

cheers

jon
 
Sorry for absence, a lot happening this week away from trading. Hope to put up some specimen charts later and tomorrow but unlikely I can do a nightly round-up for quite a while.

Anyway, China Diapers mentions SAB. This will be of interest from Monday's close onwards if it makes another 'down' day with a lower high and lower low. That will make it three falling sessions in a run since 15/02, and the three-day rule points to Tuesday would be the earliest entry day. This would come if the Monday high is breached (but not the Monday low: if both are breached, the outside bar becomes the putative swing low.). Another up day, with higher high and higher low would extend the retracement required to at least Tuesday, as long as the 15/02 high is intact: but if 2577.5 is breached, the uptrend has already resumed and there is no chance to get in long until after the next 3-day retracement. An inside day on Monday would likewise extend the wait until Tuesday for a putative swing low.

This should be a unanimous long target, as we have seen 2 successively higher swing lows since 25/11 (19/12 and 19/01) helpfully interspersed with successively higher swing highs, 02/12 and 06/01.

I'm purposely ignoring other evidence on SAB, you might look elsewhere for confirmation or otherwise and this could support going long or short or staying flat on this one: plus, as ever, a lot depends on your projected investment time frame.But I will be buying or not according solely to the sequence of EOD highs and lows.

Of course, it's very likely that the markets' positive end to this week will send price up through yesterday's high and the retracement will have been only 2 days, not 3: if so, I will have missed the boat but such is life, there are always other targets.
 
Top