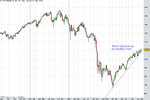
I'll start with an SPX chart; Which is the S&P 500 cash index as used by the CBOE exchange in options trading.

Monthly Chart analysis of $SPX

One thing about the TA in that chart; is that its more for 'reference' and 'interest' than to actually trade... The 'channel' is just to place on the chart as a reference rather than of any plan to short @ the high... Its just suppose to act as a guidance to ' What price has done'.
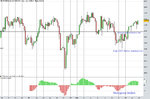
ES H0 which is the E-mini S&P 500 march contract Analysis:
24-hour 60-minute chart;

Ignore previous low liquidity.
I try centre my S/R numbers around the 5's (Which are all the options strike prices)
so for example
80,85,90
First level is the 1080.00 area
Next is 1095.00 Level
Next is the 1105 area
I'm a scalper so these levels are really more for reference that anything else; I look for initial bounces and also just look for opportunities to fade price around these areas.
Breakouts of the 1105 area have been false.
Breakouts of 1080.00 have been false (for the most part)
1095 has provided many short term bounces.
1100.00 is a scalper 00' level.
Another thing is, I only draw them when i'm sure i'm going to use them, i don't draw them 'for the sake of it' or when i'm 'unsure' or to try 'catch every bounce' - Only the ones i definately intend to use.
Other levels to watch on a 60-minute chart;
Previous Week Hi/Low
Previous Month High/Low
Weekly Pivots
Monthly Pivots
Big Daily S/R
Once again; I'll say don't draw S/R for the sake of it, only draw when your confident in them. Or you'll always exit early through fear of a bounce, having forgot that it wasn't an important level...
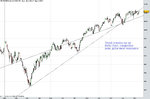
Now if we go into your trade on a daily Chart;
You have identified an uptrend...
You have identified we are currently in a range...
Don't you want to be buying the 'Pullback/Support' Rather than waiting for confirmation
For example; If you deem that the current S&P 500 is a good buy, on reasoning that considers the variables that you think are important to Supply and Demand...
So we've established;
1. You want in

How can we make this trade as profitable as possible? Buying after a decent pullback Or Buying @ support.
Buying the pullback or Support is not the REASON for entry though; Something else is, they just help you get an 'appropriate/good price'.
So your aiming for a 'low price'
If you Buy TOMMOROW;
(If we Open @ Fridays close) then you, as you can see, will be buying quite high... You may have therefore 'missed your chance'.
You would be buying Resistance. Or the 'False breakout zone'
They are just a few ideas on how you could enter a market you want to be in....
A look @ 14th Dec - 18th Dec in terms of economic news.
View attachment 14th_December_-_18th_December.pdf
http://mam.econoday.com/reports/rc/...rchive/12-14-09/index.html?cust=mam&year=2009
http://mam.econoday.com/reports/rc/...rchive/12-14-09/index.html?cust=mam&year=2009
http://www.forexfactory.com/calendar.php
Wednesday will be an important day; One you want to 'stay-in tune for' to have the right sentiment on the market.
Cheers
🙂
Friday Market Summary from Investors perspective: (From Investors.com)
Stocks Close Mixed As Volume Once Again Drops
The major indexes closed mixed Friday, but two recent patterns remained intact.
First, the low-volume trend persisted. Second, the Nasdaq once again crossed the 2200 level only to be kicked back down.
The Dow led with a 0.6% pop. The S&P 500 and the NYSE composite added 0.4% and 0.3%, respectively. The Nasdaq was a little short of break-even.
Volume was down 10% on the Nasdaq and 4% on the NYSE.
The IBD 100 fell 0.3%. For the week, it slid 0.7% — in line with the NYSE composite but trailing the other major indexes.
News was surprisingly strong on Friday, but that did little to inspire the market.
November retail sales were much better than expected. The Reuters/University of Michigan consumer sentiment index also came in better than anticipated. U.S. business inventories rose in October for the first time in more than a year, and China's November exports showed the smallest drop of 2009.
But while three of the four major indexes stretched upward, the stretch was more suggestive of a yawn than a gain. Enthusiasm is a missing factor in this market, and below-average volume confirms that reality.
If bulls were left grasping at straws last week, they found a few. At least one stock broke out every day of the week.
China-Biotics (CHBT) broke out last Monday in fast trade. Investors, however, would've had to consider two negatives. First, the dietary supplements stock is thinly traded. Second, the handle was low in relation to the whole base. A low handle is prone to failure.
By Friday, China-Biotics had slid under its 15.50 buy point.
On Tuesday, Clearwater Paper (CLW) broke out of a base-on-base in heavy volume. It's just 2% past its 51.92 buy point.
American Superconductor (AMSC) cleared a base Wednesday. The maker of wind turbines and electrical control systems is now 8% extended from its 35.88 buy point.
On Thursday, two stocks cleared their buy points.
Starbucks (SBUX) broke out of a three-weeks-tight pattern in heavy volume. It remains 1% above the 22.20 buy point.
The second was Tech Data (TECD). It punched past a 44.89 buy point in a high handle and then stalled.
Russian dairy giant Wimm-Bill-Dann Foods (WBD) cleared a 21.60 buy point in a high handle in lackluster volume Friday. It closed 3% above the potential buy point.
Although it's too early to judge these breakouts, there isn't much to cheer about at this point.
Meanwhile, gold and oil futures fell Friday, while the U.S. dollar index was higher. Among industry groups, airline stocks were the day's best performer. Oil and gold stocks led the losers.
------------------------------------------------------------------------------------------------------------------------------------
Get a live feed of the FOMC statement on Wednesday. Try stay intune to market sentiment.
Also: On the 18th S&P 500 Index changes will occur.
Some good websites for S&P 500;
www.Ransquawk.com
www.Seekingalpha.com
www.Tradethenews.com
www.Tradersaudio.com
www.Investors.com
www.Standardandpoors.com
www.ForexFactory.com
www.Fxstreet.com
www.Bloomberg.com / Bloomberg TV
http://www.econoday.com/
Anyone got any more? I can't think of my 'usuals'
Thing about Technical Analysis is its not about making it systematic like
' A channel, Buy support'
Its about viewing whats going on in the market, the order flow and price. Whats going on in the world, News and Fundamentals = Context.
Whats the current context and how can i play it ?
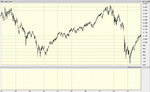
To me we are in the range until something in the 'world' that is significant happens, i'll monitor a fearful reaction through the $VIX -
The failed breakouts of 1095.00 aren't important as a 'TA' perspective... Just for a sentiment/Contextual analysis.... TA should only serve to identify 'decent entries into context' and to evaluate the current contet.
So i draw lines on charts... Then i consider whats been happening; Rejections of new highs combined with the High $VIX levels at them highs.... I'm not seeing new buyers and i'm only seeing 'fear' at the new highs... Or the locking of gains. (This is a suplement to what Robster said)
Rather than try make it easy by saying ' B/O of Triangle = Long ' - Look at the Market in as much context as you can get your hands on...
The fact i can draw a triangle isn't important to me, its on looking at how order flow is reacting to these levels, what it would take to breakout with REASON and on What it must mean (for example) if we had a false B/O.
(For example)
Anyway; Thats enough
🙂 Good luck on the coming week.