Swing trades

Hi Mr Piker,
So about these levels (which I think your trading does not pay attention to).
Check out this chart.

What do you see?

You should see how the price moves from 1 big figure to the next....... right?
Funny that isnt it........?

Do you ever watch CNBC or Bloomberg?
When they go and talk to the pit traders what do they say?
"We are looking for a retest of 15000"
They dont say "We are looking for a retest of 14964".... do they?

So hopefully your "minds eye" will have spotted these levels.
See chart.
 

Attachments

  • Spot FX GBP_USD (11-DEC-09)_S&R.png
    Spot FX GBP_USD (11-DEC-09)_S&R.png
    14.4 KB · Views: 160
So that chart is from like 1976 or something........ but are you seeing things differently now?

Take this picture into your mind..... and ask yourself where you would be trading cable to now?

ps. (i would have posted eurusd (the currency you trade, but as we all know, eurusd is a spring chicken and wasnt around in 1976)
 
Ok........

So now look, a 1hr chart....... you should see the same thing....... just a price moving around from big figure to big figure........ funny right?

It's how the big money works!! Time and again........
See how it sometimes breaks thru it but falls back? See how sometimes is breaks and goes........ all these things are tradeable.

The only thing about timeframe that I think matters is......... which timeframe can you cope with?? If you look at prices on a daily basis, you should probably trade weekly movements....... if you watch the screen all day...... you could probably trade a 15minute or possibly 5minute timeframe........ they work the same. But you must be able to react accordingly. That for me is the only difference in timeframe trading.

Is this helping at all..........????
There is so much more to be said but one step at a time.
 

Attachments

  • Spot FX GBP_USD (11-DEC-09)_1hr.png
    Spot FX GBP_USD (11-DEC-09)_1hr.png
    15.2 KB · Views: 150
Price mostly range bound 1.4-2, break of 1.6 establishes which coast is next?
 
I find your hourly chart too noisy, I would rather trade daily chart
 
Long S&P500 cash 1104.9, stop 1085

Target 1120

Reason - uptrend remains intact, buy signal triggered of a rising trend line & 4 hour chart's oscillators.

Sold 1109, not holding long stock index over weekends, will resume Sunday night
 
Sold 1109, not holding long stock index over weekends, will resume Sunday night

Why didn't you play a reversal off 1085 if it's a solid and well tested channel?

Alternatively why didn't you enter when the gap closed yesterday at about 1102 giving you another 2 pts for your entry?

Why have you closed out to resume on Sunday night if you have a target of 1120?

If you enter at 1104 with a SL @ 1085 and a TP at 1120 then you're trading 1:1 R:R

I think you can read what's going on but your entries need to improve and be closer to the 2 key levels you identified (1085 and 1020). Then you can risk less with a tighter stop and a wider TP

Geddit?
 
I definetely need to be more patient & improve on entries & stop placement. I will post more tomorrow.
I don't hold over weekend long because catastrophic events do happen and markets are closed, why trap yourself?
 
The problem I have with trading of a level rather than price action behaviour is that price tends to jerk around and how does one establish if it will break or bounce? Trend resurection on the other hand is lethal to the ones that go agaist it. Ok, I am not that accurate yet with identifying when trend is resumming as I go with oscillators instead of going with oscillators, price actio and key level hold. For instance my gold trade, to my eyes and mind trend is very strong on weekly chart, but I rushed entry, make no mistake next time I will be much shrewder and will enter when people that carry on shorting it will be crushed by the bulls, I need to wait for the time when attempts to fake the resurection will NOT BE ALLOWED.
 
The problem I have with trading of a level rather than price action behaviour is that price tends to jerk around and how does one establish if it will break or bounce? Trend resurection on the other hand is lethal to the ones that go agaist it. Ok, I am not that accurate yet with identifying when trend is resumming as I go with oscillators instead of going with oscillators, price actio and key level hold. For instance my gold trade, to my eyes and mind trend is very strong on weekly chart, but I rushed entry, make no mistake next time I will be much shrewder and will enter when people that carry on shorting it will be crushed by the bulls, I need to wait for the time when attempts to fake the resurection will NOT BE ALLOWED.
I think you need to try immerse yourself in your markets and ACTIVELY seek to understand ALL things important.

Thats the news, price, fundamentals.

Rather than avoid them to make it 'simple', involve yourself in actively assessing the market conditions and then using entries/exits appropriately to them conditions' Rather than trying a ' One template fits all '

I've learned this from experience... I'm yet to meet a trader who DOESN'T know their stuff and who DOESN'T actively engage in trying to understand their market.

For examp; I trade ES; Earnings of stocks don't mean too much for me, i check them anyway, i check them before, the date/time, their weighting and then i watch them live. I don't even act on them. I just watch, to stay involved, to hold a true sentiment....

:)

Or do you need evidence of a equity graph before you listen 2 people ? :D
 
Last edited:
D70, your charts and advice so far is being absorbed with great interest. Same goes for other posters, just don't feel cheesed off if I come out as unwilling to use your methods, I have a method, I need to see where & why & how to fix it. As an analyst I have come up with great setups in the past, but trading is so different to analysing, before I started trading I used to think if analyses is good, trade is good. Not so. I have previously lost $50,000 because even though I was ready my mind wasn't ready, so I failed. A lot of people fail & only later become truly ready, but capital is gone. I managed to get together capital which I do not intend to blow on 1 trade or die from a thousand cuts. My aim is to only trade with the main trend.
 
My aim is to only trade with the main trend.

Not sure what you mean by this, but you certainly weren't trading my trend (2 winning on Friday) with your single EURO/USD trade...:confused: Also, you mention dailys, but you took that trade off a 4 hr...:confused:
I swing trade, it's all I do, not like you though....
 
I explained it in trade plan.

If you are trading weekly trends;
You need to hold your trades longer...

You can't trade weekly trends without holding positions over the weekend, thats ridiculous!...
If you are trading Daily trends; Holding positions a few days; You need to be much more intune with the CURRENT SHORT-TERM TREND... Doesn't matter if daily is rising, if right now we are falling... And your buying and planning to sell the next tday = You are FADING the trend, not playing it.

Another thing is; There isn't always a trend.
 
Hi piker,
Here are my observations in response to the questions you answered in post #58 on P8.

Firstly, I think you're casting your net too wide, trading commodities one minute, forex the next and then indices is asking for trouble. Different markets have different characteristics and trying to apply a single strategy to all of them at once isn't doing you any favours. It might work well in one market but not the next. I suggest that you pick one and, when that's working well for you, add another (after you've tested it to ensure you get similar - or better - results).

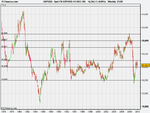
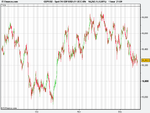
I'm trying to get a clear picture in my head of your set up. However, it strikes me as being muddled. It's based primarily around the weekly and 4 hour charts, but the Gold and S&P charts you posted on P1 of the thread are both dailies? Anyway, from your comments, this is (I think) the basic idea (for a long trade) . . .
1. Horizontal support & resistance levels are taken from the weekly chart.
2. Trend is also monitored on weekly & daily charts via trend lines. (You don't mention how you define trend or how the daily and weekly charts relate to one another. I guess you're looking for the daily trend to confirm the weekly trend in some manner - but you don't mention how?)
3. Price pulls back to either the horizontal support or a rising trendline on the weekly chart.
4. Once this set up occurs, you then look to enter on the 4 hour chart if there's divergence on MACD. As the MACD lines themselves aren't shown, I assume you're referring to a rising histogram while price continues to fall or registers a double / triple bottom?
5. Entry (long) is when the MACD histogram plots its first green bar on the 4 hour chart.

If the above is correct, it's not possible to tell how well you're executing your trade plan as we don't have 4 hour charts for two of the instruments traded. Additionally, it's not clear exactly where you plan to enter as you go on to say "d) Price on 4 hour chart breaks current reaction high." That could be a very long time after the first green bar has printed on the MACD histogram? In your posts on P1 of the thread, you make reference to 'reaction' highs / lows, although there's no mention of these in the trade plan outlined in post #58 on P8? It's not clear to me how all these different elements relate to one another?

On a general note, anyone wanting to follow your thread and make suggestions has to work very hard cross referencing info' provided in different posts on different pages of the thread. In future, it would be very helpful if you could include everything in one post. So, show the weekly chart with the trendlines and horizontal S&R drawn in. Then show the daily if it's central to your plan??? (As I've said already, for me, it's role in all this is unclear.) Lastly, show the 4 hour (ideally with the relevant lines from the weekly chart added, if applicable) and annotate the chart with your entry and stop. In the post itself, say how your conditions for the set up have been met (according to your trade plan) and ditto for the trigger to enter the trade. Hopefully then, some of the fog will begin to clear!
Tim.
 
Holding long over weekend unhedged is ridiculous

Not if you want to make any money from trading weekly trends....

It may involve risk. Thats what trading is;

As i use to say to my dad; There is a chance when i short that the market will gap up 10,000% and i'll be forever in debt. Equally, there is a bigger chance when i cross the road that i'll get hit by a bus.

I still cross roads. So i still trade short

:)
 
There is a higher risk holding long than short stock index over weekend, especially in turbulent times we are living today. It' a fact, ask around
 
There is a higher risk holding long than short stock index over weekend, especially in turbulent times we are living today. It' a fact, ask around

Haha; No there isn't!

Shorting = Unlimited risk
Longing = Limited risk

I don't need to ask around; I'm the guy you should be asking, your asking the wrong guys.

Its a fact that historically markets have on average RISEN overnight and FALLEN during RTH hours (in stocks)

There is TWO reasons its more risky to hold long over the weekend, what are yours?
 
A margin call, unless you allocate 50000 per contract or no leverage. Black Monday anyone? Risk of financial ruin outweighs any statistical average, you can't exclude random events
 
Last edited:
Top