Swing-day trading US stocks

Tonight, 1/5/09, My filter is spitting out all these bond funds, e.g., ITE, and based on my reading of price action and technicals, e.g., Wkly Wms %R, etc., they look like great candidates to head higher. We shall see I guess. My question is, what does this mean for the broader market, if anything, and why?

Also looks like energy stocks are headed for a retracement back down. ERY, triple short energy ETF, looks headed up, working off a doji and very high volume today. I am buying ERY at $33.05 after it breaks above the doji and through $33.00. Any thoughts?
 
Last edited:
Tonight, 1/5/09, My filter is spitting out all these bond funds, e.g., ITE, and based on my reading of price action and technicals, e.g., Wkly Wms %R, etc., they look like great candidates to head higher. We shall see I guess. My question is, what does this mean for the broader market, if anything, and why?

Also looks like energy stocks are headed for a retracement back down. ERY, triple short energy ETF, looks headed up, working off a doji and very high volume today. I am buying ERY at $33.05 after it breaks above the doji and through $33.00. Any thoughts?


ERY look good. I would use stop under low and have chances for good day trade and maybe swing trade. Nice 60 min CCI setup (triple divergence) and imo have good chances to go up. 32.50-33 is first resistance what I see right now.
Best luck
 
Also looks like energy stocks are headed for a retracement back down. ERY, triple short energy ETF, looks headed up, working off a doji and very high volume today. I am buying ERY at $33.05 after it breaks above the doji and through $33.00. Any thoughts?
Just an update on this trade. It did not hit the 33.05 level for the trader's trick entry on Tuesday but was clearly forming a pin bar so I got in at 29.88 and banked a little right away. Today it really picked up steam, just as all the energy stocks began to tank, and has been a great swing trade so far, currently at 34.00. Looking for a target of 37.00 where it hits downward trend line. I am looking for another good market down day tomorrow, lower oil prices, lower energy stock prices, and thus higher for ERY.

Cheers!:clap:
 
Good day,

Here are several ideas what I will watch for Monday. Right now I don’t want take short trade longer then day trade and focus is on possible market correction. Because of that I will watch long ideas. If market will continue with selling I will just watch without open position.

1. HA – based on intraday cup and handle. Possible continuation (move-rest-move)
http://ivicatradingcharts.com/2009/03092009ha.jpg

2. CTX – Rounding bottom and reversal H&S pattern. KBH and PWR are same sector and I will follow them too. http://ivicatradingcharts.com/2009/03092009ctx.jpg


3. BX – 5 min cup and handle, but also daily/120 min consolidation and for interest need to stay above 10/20sma on the daily chart http://ivicatradingcharts.com/2009/03092009bx.jpg


4. PFE – after CCI setup before three days PFE showing nice consolidation and Friday try for continuation is third try and it will be in focus for breakout trade. http://ivicatradingcharts.com/2009/03092009pfe.jpg


5. WFMI – I follow that one some time and it is still above 20sma on the daily chart. I will look for bounce, but without market help it will be hard to see move to $15 resistance area http://ivicatradingcharts.com/2009/03092009wfmi.jpg


6. DAL and ACGL are both CCI setups. I found many CCI ideas and I will post those, but outside are number similar setups because indices charts look similar. http://ivicatradingcharts.com/2009/03092009dal.jpg
http://ivicatradingcharts.com/2009/03092009acgl.jpg


I wish you all good trading and if market reversal will be today, I think they could be useful setups.

Ivica
 
Good day!

The market yawned after the biggest deal day in years. Roche upped the DNA bid, MRK is buying SGP and DOW is buying Rohm and Haas. Not much to say that is new after the weekend commentary and expectations for this week. After Monday's action nothing changed. Indices started the day with a gap down the gap was filled right after the open and the QQQQ broke to new highs to Friday's high resistance area. The SPY and the DIA back to near Friday's high and that was all what we saw from Indices strength for Monday. The rest of the day we saw slow selling pressure which turned most of the day in to the downtrend. On the 60 min chart we can see that Friday's bounce pace is stronger than Monday selling which gives us hope that Friday's low will hold even as a double bottom pattern. The QQQQ was the weakest and closed at the lows which suggests for a possible gap down. Since the selling pressure is very strong it is normal to expect that a recover won’t be easy and fast. Right now if Friday's low does hold we have fair odds for a rounding bottom pattern. But it is to early to be sure. Only positive right now is that Friday's buying pace is still stronger than Monday's selling, which gives us hope that the support will hold. My focus will stay the same as on Monday and all updates will be in the room.
Those of you that used to come into the trading room and stopped, I want to tell you I am back full time and welcome all of you to come again. There is nothing to lose since there is no charge for the service right now. I look forward to seeing you all there.


Watch ideas for 03/10/2009

http://ivicatradingcharts.com/2009/03102009amb.jpg

http://ivicatradingcharts.com/2009/03102009cf.jpg

http://ivicatradingcharts.com/2009/03102009wre.jpg
HR, HME and FRT

http://ivicatradingcharts.com/2009/03102009usb.jpg
CMA, MI, PNC, STI, NYX, FMER, FULT, UBSI are same sectors and they all will be on the watch list.

Wish you all good trading and if anyone will have any question feel free to contact me.

Ivica
 
Good day!

Finally we got what we expected last days. Indices formed daily/weekly CCI setup possibility and that was reason why we stayed in several swing setups after Monday slow trend day down. True, it was high risk and because of that our o/n risk was not big, but reversals can back on this way. Day started with strong gap up. For the DIA and the SPY it was gap near Monday high, while the QQQQ gapped above 20sma 60 min. I mention several times in the past that I can’t imagine bounce without strong financials and that was trigger what we had at Tuesday. After gap up rest of the day we saw buying pressure all day what result with trend day. We had very busy morning with number of good setups and rest of the day we just managed them for profits. Now what? Well, we can see that the QQQQ have room for more upside move in the morning, the DIA have some room to while the SPY closed at 03/04/2009 gap resistance area. On the 60 min charts we can see that charts are extended, but on the daily charts we can see that all have room for more upside move next days. Also we know that after trend day we can expect consolidation day. It is hard to tell what will be in the morning. Will indices just continue with buying pressure or 60 min consolidation will start. But we know what risk will be on new setups. Since 60 min charts are extended, risk for new setups will be higher risk, unless they will be fast trades. It will be good day to manage open swing trades and we have enough of them. My focus will stay for long setups, but they will mostly be intraday setups, and I will manage open swing trades. Since indices had daily CCI setup, I will look at least for 20sma resistance area, but that will also depend on pace and volume.
Those of you that used to come into the trading room and stopped, I want to tell you I am back full time and welcome all of you to come again. There is nothing to lose since there is no charge for the service right now. I look forward to seeing you all there.


Watch ideas for today

http://ivicatradingcharts.com/2009/03112009rtn.jpg

http://ivicatradingcharts.com/2009/03112009cedc.jpg

http://ivicatradingcharts.com/2009/03112009fnb.jpg

http://ivicatradingcharts.com/2009/03112009syk.jpg

Wish you all good trading

Ivica
 
Chart of the week

Date: 04/06/2009

Symbol: NFLX
Company Profile: Netflix, Inc. provides online movie rental subscription services in the United States. The company offers its subscribers access to a library of movie, television, and other filmed entertainment titles on digital versatile disc (DVD).

Sector: Services
Industry: Music & Video Stores

TRADING PLAN
Entry price: above 44.00
Stop price: under: 42.50
Target area: 47.50-50 area

Chart explanation:
I like NFLX consolidation (triangle) and if pattern will hold I will take it above 44.00 areas what is resistance area. Next resistance is $45 area s number resistance area, but if we look at weekly/monthly chart we can se that NFLX have plenty of room for upside move since that will be new high ever. Because of that I will look for $47.50 as equal move and $50 area as whole number for target area. On the chart I draw triangle and equal move lines, but also we can see that is just part of cup and handle.

http://ivicatradingcharts.com/2009/04062009nflx.jpg


Ivica Juracic
 
Stock recommendation

Symbol: GMR
Company Profile: General Maritime Corporation provides seaborne crude oil transportation services worldwide
Sector: Services
Industry: Shipping
TRADING PLAN
Entry price: 8.50
Stop price: 9.06
Target area: 7.50-6.50 area

Chart explanation: GMR is obviously weaker then market and look like have “own way”. I will look for selling continuation and pull back from daily 10sma resistance area- Equal move is around $7.50 area and previous low is $6.50 area what will be monthly double bottom pattern. If market will start with weekly correction I will expect from GMR to continue with down trend action.
If anyone have any question or need update feel contact me over email or in the live trading room.

http://ivicatradingcharts.com/2009/07202009gmr.jpg

Ivica trading charts

Ivica
 
07272009cvh.jpg


Ivica trading charts
 
Position Trade

Date: 08/10/2009
Symbol: NUAN

Company Profile: Nuance Communications, Inc. offers speech-based solutions for businesses and consumers worldwide.
Sector: Technology
Industry: Application Software

Trading Strategy:
NUAN is trying to break up from consolidation on the weekly chart. It is third try and usually third try will be charm, but also we know what can happen if third try won’t work and because of that I won’t use big stop. It is “do or die” situation and I will use stop under: $12.75. It can be tighter: under $12.90 and I will move it fast when I will see setup action. On the monthly chart we can see clear consolidation under 20sma resistance area what have tendency that resistance will be broken. $20 is first resistance area and depends on pace and volume I will look for target or partials.

I will send all updates and if anyone will have any questions feel free to contact me in the room or over email ([email protected] ).

08102009nuan.jpg
08102009nuanm.jpg
 
Chart of the week

Chart of the week

Date: 08/31/2009
Symbol: GG
Company Profile: Goldcorp Inc., together with its subsidiaries, engages in the acquisition, exploration, development, and operation of precious metal properties in Canada, the United States, Mexico, and central and South America.
Sector: Basic Materials
Industry: Gold

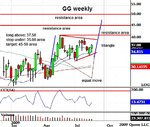
TRADING PLAN

Entry price: above 37.50
Stop price: under 35 (34.50)
Target: 50 areas

08312009gg.jpg


Chart explanation: GG forming weekly triangle and next try for break up will be third try and you all know that is one of my favor pattern. Setup above 37.50 is above last week high and it is “early setup”. If we will look for book setup then it will be above $40 (previous weekly high). Because of that I will start with half risk and then I will add above $40. GG all time high is $52.85 and on the monthly chart we can see that GG have room to reach $50 area what is price and previous high resistance area. Daily action is whippy and because of that it is good only for swing trade.
 
[13:06] <ivica> 13:06:35 STOCK SWING TRADE: BUY SETUP ROVI above 44.50, stop under 43.20
 
Last edited by a moderator:
[13:06] <ivica> 13:06:35 STOCK SWING TRADE: BUY SETUP ROVI above 44.50, stop under 43.20


09082010rovi.jpg
 
VZ long above: 30.50, stop under: 30.00

COH long above: 39.42, stop under 39.10m target 40 area

HRS short
 
Last edited by a moderator:
Chart of the week

Date: 09/13/2010

Symbol: CNK

Company Profile: Cinemark Holdings, Inc. and subsidiaries engage in the motion picture exhibition business. As of December 31, 2009, the company operated 424 theatres and 4,896 screens in the United States, Canada, and Latin America. The company also manages theatres in the United States, Brazil, and Colombia. Cinemark Holdings is headquartered in Plano, Texas

Sector: Services

Industry: Movie Production, Theaters


Chart explanation: It will be ideal if CNK will stay day or two in range and if will wait daily 10sma as support for bounce. But without that CNK formed NR7 bar, also weekly continuation pattern at there is room for (at least) previous high what is initial target
If anyone will have any question please feel free to contact me.

Long above: 16.00
Stop under: 15.75
Target: 17 areas


09132010cnk.jpg
 
09142010rose.jpg


I will follow ROSE for swing short if market will start correction.
Under 20.50, with stop above; 21.00 and target 17.50 area.

There are more ideas but don't know how to post more then one chart and if anyone interested can contact me
 
Top