xpertstocktrader
Established member
- Messages
- 874
- Likes
- 6
POSITION TRADE
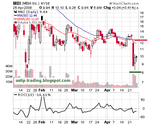
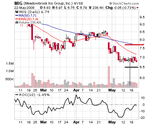
Symbol: BMC
Company Profile:
BMC Software, Inc. and its subsidiaries develop software that provides systems and service management solutions for large enterprises. It operates in four segments: Mainframe Management, Distributed Systems Management, Service Management, and Identity Management.
Sector: Technology
Industry: Application Software
Trading Strategy:
On the Monthly chart we can see that BMC forming triangle pattern and possible 3rd try triangle pattern. It is uptrend stock and that is one of my favor patterns. It is still not on the monthly triangle breakup point, but if we take a look at weekly chart we can see nice “early” position trade opportunity. Weekly chart also formed 3rd try breakup possibility with continuation pattern what will increase possibility for good risk reward trade. I will look for buy above last week high with stop under last week low what will be start for swing trade what can easily turn to position trade based on monthly 3rd try triangle possibility. This is good example of my work. I always try to find setup on multi time frames to increase reward and cut risk for low risk setups.
http://www.ivicacharts.com/diagrams/2008/04282008bmc.jpg
http://www.ivicacharts.com/diagrams/2008/04282008bmcweekly.jpg
If anyone will have any question please feel free to contact me
Kind regards
Ivica Juracic