Swing and Position Trading

aspex said:
I suspect that RTR is not one to put your hat on either long or short at this moment despite some brokers suggesting big gains (kiss of death?)

Personally I would like to look at swing trading prospects in the FTSE100 and possibly the 250 as well that do have the potential to move away from present levels.
I accept both long and short opportunities here.

Meanwhile i will look around and make asuggestion or two.
Would one of our very small group here like to profer theirs?

aspex

I am prepared to post suggestions. May I suggest that suggestions for going long or short be accompanied by reasons why, otherwise there is little to be gained. Use of charts to explain the trade are worth a thousand words.

regards

bracke
 
bracke said:
aspex

I am prepared to post suggestions. May I suggest that suggestions for going long or short be accompanied by reasons why, otherwise there is little to be gained. Use of charts to explain the trade are worth a thousand words.

regards

bracke
bracke,
That is exactly how i would want it. The logic behind any move is possibly more important than the move itself. At some stage the general market must reverse and my eye is also on opportunities like that. I that line the following is not a suggestion but more an example of what is 99% certain to occur.
SVG Capital (SVI) which is a component of the FT250 is now at a premium to NAV had raced 40% ahead of the index over 3 years. Harder times always correct these actions.
From a TA viewpoint I keep looking for some of the pointers mentioned by various authors/gurus(?)
 
aspex said:
bracke,
That is exactly how i would want it. The logic behind any move is possibly more important than the move itself. At some stage the general market must reverse and my eye is also on opportunities like that. I that line the following is not a suggestion but more an example of what is 99% certain to occur.
SVG Capital (SVI) which is a component of the FT250 is now at a premium to NAV had raced 40% ahead of the index over 3 years. Harder times always correct these actions.
From a TA viewpoint I keep looking for some of the pointers mentioned by various authors/gurus(?)

aspex

I had no previous knowledge of svi but I have now looked at the charts (6 month is shown below ).

An impressive chart if you were long, having reached an all time high of 715 a few weeks ago. This is somewhat surprising as the turnover is increasing but the profit and eps are negative, maybe I am missing something.

I have shown what I perceive to be the next s/r levels it will be interesting to see what the price does if/when it falls to 670 or rises to 715.

What strategy do you use to trade - price/volume, indicators, fundamentals or some other?

Regards

bracke
 

Attachments

  • svi 6 months.jpg
    svi 6 months.jpg
    62.3 KB · Views: 328
bracke,
From a fundamental view SVI is an investment trust using venture capital techniques as I understand.
It therefore trades on the expectations of its investors and has no interest in earnings right now.
Therefore i this rising market its discount trends toward a premium in underlying assets (as it has done)
What happens when the fall comes islikely to be magnified within the price.

My trading tends toward momentum without much TA involvement.
However I continue to look for factors used by Alexander Elder in his books.
I have yet to find these in the raw but as always can see the ones I missed over previous months.
If I find a good one I will let you know.
 
aspex said:
bracke,
From a fundamental view SVI is an investment trust using venture capital techniques as I understand.
It therefore trades on the expectations of its investors and has no interest in earnings right now.
Therefore i this rising market its discount trends toward a premium in underlying assets (as it has done)
What happens when the fall comes islikely to be magnified within the price.

My trading tends toward momentum without much TA involvement.
However I continue to look for factors used by Alexander Elder in his books.
I have yet to find these in the raw but as always can see the ones I missed over previous months.
If I find a good one I will let you know.

aspex

Thank you for the SVI information. A case of 'Great Expectations' but if it is not making money now when is it going to!

I have not read Elder but have concentrated on supply/demand, price/volume, support/resistanc and trend.

When you do identify "a good one" it will be interesting to compare my own TA strategy.

Regards

bracke
 
aspex said:
Bracke,
Going on your ideas WHY looks a good prospect???

aspex

Please excuse my delay in replying, I have not had time to visit the site since you posted.

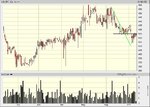
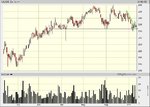
I am not familiar with why but have looked at the charts which I attach below with added s/r and trend lines.

The highest the price has been for ten years is 240 so when it rose above this level it was in new territory with no s/r to refer to as to where the rise might stop or stall.

During the course of the rise it met resistance in the 270/280 zone but overcame that zone and has continued to power ahead. I do not know where it will run out of steam and when it does whether it will fall or move sideways. If the price does fall 270/280 may provide support and thereafter 240.

One to watch

Regards

bracke
 

Attachments

  • why - 6 months.jpg
    why - 6 months.jpg
    55.7 KB · Views: 268
  • why-12 months.jpg
    why-12 months.jpg
    60 KB · Views: 314
a possible long

Any thoughts on the chart attached - IMI.

doesn't quite follow trendlines exactly - but to me it looks quite good on the weekly and daily charts.

Also - there's a decent divergence on the MACD hitsogram.

I'm looking to enter once the price breaks the september downtrend at approx 430 - I'll then keep a close eye at the 440 resistance level. (& bail out if required)

I'm also looking at SGE - very similar scenario - including a slight divergence on the MACD Histogram

Cheers

Rex
 

Attachments

  • IMI.gif
    IMI.gif
    26.3 KB · Views: 279
Hi!

Hi everybody,

I usually participate in the other swing trading board, but now that I have a little bit more time I'd like to post in this one too. I think here you're aiming at a longer term than in the other board, which is good for me because I trade in both medium and short term.

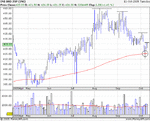
So, I'll start my contribution by giving my opinion on IMI's chart posted by Rex. I think it looks a good long if you take it out of the general picture. What I mean by this is that at the moment I'm waiting to get into longs (unless I find a pretty obvious one with low risk), I'm not feeling safe in the long side. To support your long position you can add that the 200-ema is very close, and was tested with a healthy bounced back. BUT, it didn't manage to carry up, and it seems to be making another swing. If I was to enter that share, I'd wait for a clear change of trend, this means, once the next swing shows that the low is above the previous one. For example, say it goes down to 420 (may be 416) and then it goes up from there, that could be an entry sign for me (I also check the intraday charts to look for a good entry, usually a 10 day chart).
Respect to SGE, I think the same. I'd wait for a confirmation of trend change.

Great board.
Good trading!

Silvia.
 

Attachments

  • IMI.gif
    IMI.gif
    21.9 KB · Views: 265
Rex79 said:
Any thoughts on the chart attached - IMI.

doesn't quite follow trendlines exactly - but to me it looks quite good on the weekly and daily charts.

Also - there's a decent divergence on the MACD hitsogram.

I'm looking to enter once the price breaks the september downtrend at approx 430 - I'll then keep a close eye at the 440 resistance level. (& bail out if required)

I'm also looking at SGE - very similar scenario - including a slight divergence on the MACD Histogram

Cheers

Rex

Rex

The 6 month charts for imi and sge are shown below. I cannot comment on MACD or other indicators as I use only price and volume.

Both of these shares appear to be following the same pattern as the ftse 100, so whither that goest these will likely follow.

IMI - I find it difficult to pick out a s/r at 440 it appears to be more of a 435/440 zone. If you go long at approx 430 where would you place your stoploss, bearing in mind that the normal daily price range is 10/15 points ?

SGE - A clearer picture on the s/r front at 222.

I think that the ftse100 holds the key for these two shares and lots of others. I would be inclined to hold fire until the ftse100 decides where it is going. In other words trade with the trend and at the moment that is not clear.

I wish you good fortune.

Regards

bracke
 

Attachments

  • imi-6 months.jpg
    imi-6 months.jpg
    91.3 KB · Views: 246
  • sge - 6months.jpg
    sge - 6months.jpg
    79.1 KB · Views: 234
Rex,

I am always trying to understand volume signals, but with no real success. I use the chart without indicators, exept a MA for trend indication. My impression is that 405-410 is a tested support area near term. Until then, you are in a "hook" a, which could be a good shorting possibility.

Just to put my neck on the block, I shorted BP just now at 639 because of that hook business. What do you think ? BP is one of the few shares up this morning- another reason for shorting.

Split
 
Thanks for your replies all:

Silviaic - couldn't agree more - both selections are only potential longs at the minute and I'm waiting for a signal before considering entering on either.

Bracke - - I'm aiming eventually to use just price and volume - but am still learning - at the minute I find some indicators help me out, Thanks for the charts - your right SGE looks more defined than IMI.

SplitLink - I'm not very clear on volume signals either - but I don't think IMI would make a good short -as for shorting BP it wouldn't be my choice - I'm also not clear why the hook thats's forming warrants a short

Bracke - Silviaic would you short BP today ?>

Thanks again for the replies - Rex
 
Rex79 said:
Thanks for your replies all:
Bracke - Silviaic would you short BP today ?>

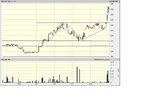
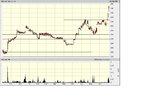
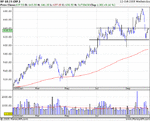
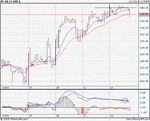
Yes, may be...It all depends on where you put your sl. May be I'd wait a little bit for confimation on the daily chart, which looks like making the top of the swing. On the other hand the intraday chart shows that it is struggling to cross above 640 and it stayed there all morning. This could be a very good entry point with a very tight stop loss, for a low risk trade. I also marked what could be a sell signal on the macd of the intraday chart...

Good trading!

Silvia.
 

Attachments

  • BP_.gif
    BP_.gif
    19.7 KB · Views: 258
  • BP_5day.gif
    BP_5day.gif
    20.6 KB · Views: 249
Rex

Would I short BP to-day?

BP is not on my watch list so I cannot offer much thought on the matter other than to say that as to-day is a down day it may be possible to make a few points on an intraday trade.

But as I posted earlier I would want the ftse to decide on direction before I would day trade it..

Regards

bracke
 
Rex79 said:
Thanks for your replies all:


SplitLink - I'm not very clear on volume signals either - but I don't think IMI would make a good short -as for shorting BP it wouldn't be my choice - I'm also not clear why the hook thats's forming warrants a short

Bracke - Silviaic would you short BP today ?>

Thanks again for the replies - Rex

:LOL: You asking for support?

Well, an explanation on the hook point. Have you read John Piper's "The Way to Trade"?
There's a lot in there that's guff, in my view. All the psychology stuff being for the bin, but he introduced me to the idea behind Market Profile. This is based on the statistical bell chart which, when used in share charting means that over a certain period of time, when the price of a share is two standard deviations away from the mean, it tends to come back to the centre. Therefore, once the trend has been established the minimum risk will be to short on the top side, if the trend is down, when the price is that 2 standard deviations away. The idea being that, if you are wrong about the trend, it is still possible to get into a position where you can break even and even reverse if you feel cute.

This makes a lot of sense to me and I use it practically all the time although I make mistakes and it hasn't made me rich,yet. BP, by they way has closed 4 points to the good and I have rolled over for tomorrow. I'll have a look at yours, later.

P.S. This isn't an easy way to make a fortune- nothing ever is, is it? But it gives me rules for entering a trade and keeping my stops fairly close.

Split
 
silviaic said:
Yes, may be...It all depends on where you put your sl. May be I'd wait a little bit for confimation on the daily chart, which looks like making the top of the swing. On the other hand the intraday chart shows that it is struggling to cross above 640 and it stayed there all morning. This could be a very good entry point with a very tight stop loss, for a low risk trade. I also marked what could be a sell signal on the macd of the intraday chart...

Good trading!

Silvia.

Yes, 640 was the level I used. BP has closed down about 4 points clear, I believe. The first objective is to be able to move the SL into profit. Once in profit one can start looking for another share with as low a risk as possible The last two I had went wrong on me this morning, PRU and WPP, but I was out with a net loss of 5 points. You have to be careful in the first hour's trading when the spreads are often wide.

Thanks for your posts.

Split
 
I thought you'll enjoy the following comment (specially Split),

This morning in MoneyAM:

FTSE continues lower
Headline shares opened lower this morning, following last night's falls on Wall Street, with mining stocks weak, although BP gained (?) on reports of possible expansion into China :eek:

Silvia.
 
Last edited:
stings a bit

All my recent positions were long - all of the wiped out -

stings a bit

Rex

Anyone seen anything interesting ? will post some potential longs and shorts tomorrow.

Rex
 
Using the MACD

Hey guys, trading has been very interesting over the last few days. Yesterday I set traps to enter NWG,RR,RDSB. I got filled on RR,RDSB late in the day. I closed all these positions today with healthy profits. When i started to understand my position sizing i knew what points were roughly high and lows for the day. Because I began to understand what a solid profit was in relation to the size of the position. This has helped me get really close in exiting at the highs and lows of the day.

I revamped my version of an Elder Rating plan grouping each stock in its sector and then used 3 MACD settings to analyse them on a weekly chart. This may sound a little MACD crazy but I'll explain.

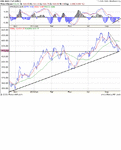
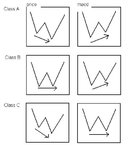
First I use a short term MACD (20,9,9) on a weekly chart. This prints divergence and signal line crosses early and i use these signals lightly. Second I use a the standard setting 12,26 with is my middle ground. Then I use a long setting (38,18,9) which rarely prints signal line divergence, but when it does it points to a serious reversal. Using the big picture weekly check really helps my short term trading. It tends to put the odds in my favour knowing where the stocks are in their long term cycles. I run through each stock (roughly 100) checking for signal line divergences and recent weekly signal line crosses above and below 0. Then I can rate each sig. line div. and cross above/below 0 depending on how many of the 3 MACD settings these signals showed up on. You can then class each divergence. ( see picture)

I just thought i'd share this stuff with you guys. Trade to trade well, the profits are a by-product of good disciplined trading.
 

Attachments

  • Divergences 1.JPG
    Divergences 1.JPG
    26.2 KB · Views: 295
Good stuff Techst,

I've been starting to look at things that way - weekly MACD then daily - haven't quite got it right yet though, - I've been entering too early not studying the daily's enough - and often getting stopped out,

Sounds a good idea to run MACD at different setting as well - what do you pay most attention to the signal line or the Histogram ?? - I've been looking th the histogram mainly.

Cheers
Rex

Good post Techst!
 
Top