techst@ said:
Out of those i'd pay attentionto the RSI, looking for divergences that are confirmed by the MACD. And also looking for extreme readings of the RSI, hence your RSI with Area use. This can be useful to spot potential tops and bottoms. But be sure to use price and 1-2-3 reversals to confirm these tops/bottoms.
Hi techst@ and Rex79,
I have been reading the posts between you with interest as I have been expounding, for some time now, using the bar chart without indicators. I would like to include volume but, even with Db's thread, I do not think that I will ever understand it sufficiently enough to be able to trade confidently.
To help me with my forecasting I did some testing, using your undicators, MACD and RSE
and came up with some interesting results. It, also, made me think about techst@'s comments referring to the inclusion of fundamentals in trading.
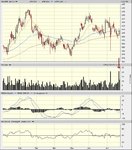
I hold some ScS Upholstery shares.
This company is a high street retailer and they are in poor repute just now, Even though it has yield of 4.27%, Last earnings growth of 66%, future growth prospects of 15%, ROCE 62.9
Net gearing -55.6, and a peg of 0.7 (at current price), this company's price has slide from 423p to 305p since the end of March. If you care to look at the results (SUY) on UK Wire you will see that the directors are confident about the future.
This shows that fundamentals do not, necessarily, help a trader. He could have lost a lot over the last four months if he had been long in March and hadn't used stops. But my chart and your indicators would have shown me the warning signs between a and a1; b and b1 and potential rise (?) c and c1.
What do you think?
Split