Drax Trades
Nice to hear from you Rex been a long time since we were both active here.
Hopefully some fellow swing traders will join us and come out of the woodwork.
Posting some of their ideas, thoughts and trades.
I may find a better way to display my charts as the PDF appears to be blurred.
But I've just moved over to using Microsoft OneNote so still getting used to it.
I used to post interesting setups here, trades I was entering. Going forward I'm gonna explain the reasoning behind my trades I have recently taken or have partially taken profit on already. Posting everything here will take too much work and I don't like tying up my opinion on a stock on a forum, mainly because my opinion can change quickly on a setup. And plus it's not all about entries anyway. I'll post some examples of what I mean in the future.
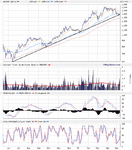
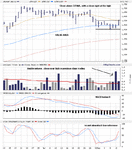
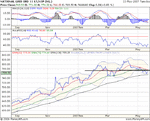
Drax Group (see chart)
For a utility stock this has a nice chunky channel, wide swing movements with plenty of room to make gains in.
Chart Key - Orange dots are entries, Purple dots exits
Arrows - show the areas that were focusing my attention to trading this
Purple lines - just showing what volume was related to what days candle
Drax is in a bear market, moves to value trigger my interest. As the stock rises towards the 70EMA it goes on my watchlist.
The first arrow (late Oct) is pointing to an entry I would take, I was tied up in other stocks when this came about so didn't hit it and for me, this is the stocks 1st attempt to leaving the value area so I would tread with caution anyway. The stocks been in the value area and it closing near the low on improved volume.
By the time the second (2nd attempt to leave value) arrow comes round I'm free capital wise to trade this. Plus, this signal is sooo good I really can't not take it. On the first orange dot (entry day) the stock closes down right at the close on strong volume. It's the large upward move previously (2nd purple line) that makes this a solid setup. The entry day and the strong close wipes out any gains and leaves bulls scrambling, it's quite possible those bulls were bears who are now short covering from the first attempt to move from value.
There's so many players in markets all with different strategies it doesn't really matter how I rationalise it, you see false upside/downside breakouts all the time. The market needs to catch the majority on the wrong side of the trade in order move in its intended direction. And that’s what this did it's as clear as day here on that chart to me.
I then sold half as it gapped down then sold the following few days later.
The second is the same but from the long side. 3 attempts to move up, large volume, bulls (bottom pickers and short covering) hoping to pick the next move up keep getting trapped as their gains are wiped out as the stocks continues to close down flushing out weak hands. Then once again the trade is staring me in face and I can't turn down a quick countertrend move back to the value area. It’s the closing prices that are important here. The stock had several attempts to move higher in the morning/midday then closing lower creating the flush out.
A lot of what I'm doing here in terms of analysis is done everyday when the stock's on my watchlist. Looking at the chart several times a day and just checking it's progress seeing where the important levels are and having a planned entry, stop and target ready if the stock moves below or above a certain point. If the stock doesn't move as I pictured, then I don't trade it and I move onto something else, leaving it on my watchlist to keep an eye on it. There's plenty of opportunities out there
Merry Xmas and a Happy New Year x