Swing and Position Trading

I agree it's not a massive divergence - but a similar pattern was emerging in MFI, and momentum. sorry can't post chart at moment - will do so tomorrow.


Rex

aspex said:
Rex,
Nice chart but is the MACD latest top just a little too high still.
I would like to see an even lower one to confirm.
 
Thanks for responding you blokes.

It just shows how jumpy I am with this current market.Yesterday I thought the bottom had fallen out of the market,but to day it has bounced back up again.I am currently long with BLT and RIO, yesterday I was in a flap over losses and to day I have come back into profit.

I keep looking at the FTSE 100 index and wonder how much longer it will continue to go up and thats when I get nervous.
Any way, I shall continue to trade on the long side and keep my fingers crossed.
I recently shorted Next and covered it before it went up again,not too sure about shorting other stocks at the moment.
Sell in May etc etc .
LOL Jon
 
Fluke , I am in a similar situation to yourself - 'how long will it go up' - I'm not sure - at the moment I think the markets going to slide down some more - be careful, tight stops all the way !!

my view is it may slide again tomorrow - hopefully other markets will give us a clue tonight
Rex


Fluke said:
Thanks for responding you blokes.

It just shows how jumpy I am with this current market.Yesterday I thought the bottom had fallen out of the market,but to day it has bounced back up again.I am currently long with BLT and RIO, yesterday I was in a flap over losses and to day I have come back into profit.

I keep looking at the FTSE 100 index and wonder how much longer it will continue to go up and thats when I get nervous.
Any way, I shall continue to trade on the long side and keep my fingers crossed.
I recently shorted Next and covered it before it went up again,not too sure about shorting other stocks at the moment.
Sell in May etc etc .
LOL Jon
 
Rex79 said:
Fluke , I am in a similar situation to yourself - 'how long will it go up' - I'm not sure - at the moment I think the markets going to slide down some more - be careful, tight stops all the way !!

my view is it may slide again tomorrow - hopefully other markets will give us a clue tonight
Rex
Rex.

My plan at the moment is to take any profit off the table and not wait for any target ,just take the money.
I closed both my positions with Rio and BLT at the top of today's price rise, because I am out all day tomorrow and would be really brassed off ,if I lost my gains from them.
You win some and loose some!!.

Regards Jon
 
barjon said:
Happy New Year everyone

Since I mentioned it back in November http://www.trade2win.com/boards/showpost.php?p=217921&postcount=203 I thought I'd update.

Well, I did go short (first yellow circle) and as it turned out I was very lucky to get my first target (1:1) and was then stopped out on the remainder at breakeven. The price then moved on to take out the red swing high which changed the trend back to up.

Then a very neat first reaction came with a highly profitable - as it turned out - entry signalled (second yellow circle). Did I take it? No, still fixated by my bear views :eek: Just goes to prove you should trade your rules and not your opinions.

Good trading

jon

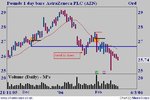
Since I started on about azn back in November and updated in December http://www.trade2win.com/boards/showpost.php?p=229385&postcount=253 I thought I'd keep it going with another update.

The swing low that signalled the end of the "very neat reaction" I mentioned was eventually taken out (although not by much) changing the trend to down (hurrah :rolleyes: ). That came a few days after a large gap down (breakaway gap?). The susbsequent reaction gave a swing high and a short entry which is still in play.


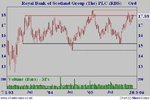
You might also care to cast your rules over rbs which has been stuck in a trading range for nigh on three years. Preliminary results next Tuesday may trigger some fast action one way or the other.

good trading

jon
 

Attachments

  • azn.JPG
    azn.JPG
    37.4 KB · Views: 366
  • rbs.JPG
    rbs.JPG
    39.7 KB · Views: 316
barjon said:
Since I started on about azn back in November and updated in December http://www.trade2win.com/boards/showpost.php?p=229385&postcount=253 I thought I'd keep it going with another update.

The swing low that signalled the end of the "very neat reaction" I mentioned was eventually taken out (although not by much) changing the trend to down (hurrah :rolleyes: ). That came a few days after a large gap down (breakaway gap?). The susbsequent reaction gave a swing high and a short entry which is still in play.


You might also care to cast your rules over rbs which has been stuck in a trading range for nigh on three years. Preliminary results next Tuesday may trigger some fast action one way or the other.

good trading

jon


Oh Mighty Moderator

Merely a comment to tickle your rbs.

The pattern with results appears to be: Good Results = Profit taking and resultant fall in price particularly if price is at top of range or close to resistance. May then rise depending on supply/demand back to top of range and possible breakout.

Poor Result = Price fall particularly if near top of range or resistance, ossibly back to bottom of range or next support

What constitutes good or poor? Expectations!

I will look forward to next Tuesday.


Regards

bracke
 
RBS toppy at the beginning of the day.
Then the traders drop off the pace.
Interesting day Tuesday.
The results need to be very good to sustain a rise.....
..... except if there is an announcement of a substantial share buyback.
 
Come on barjon, I am awaiting your comments relating to rbs with colonic anticipation.

Don't be shy lets read your comments. Or could it be that you are too busy counting your winnings as a result of going long on rbs?

Regards

bracke
 
bracke said:
Come on barjon, I am awaiting your comments relating to rbs with colonic anticipation.

Don't be shy lets read your comments. Or could it be that you are too busy counting your winnings as a result of going long on rbs?

Regards

bracke


:LOL: an' i faded the open :D :D

jon
 
Dropped out of RBS at 1936.
This one has been more than a swing trade.
CFDs held for 20 and 6 months but the profit was 130% on the margin overall.

Looking seriously at the Nas100 (NDX) basing entry on the after-hours moves compared to the close
During the month of February there were four gains of 15 points or more and one stop out based on my rules for setting stop buy/sells, stop loss and limit sell/buy. All triggers subsequent to the limit being achieved can be moved with the market but I have chosen in this test not to move any. Consequently some profit has been foregone as the stop has closed the contract.
I will keep to testing for another month because of an upcoming period away from access to the market.
 
Last edited:
One to watch enterprise Inns (ETI)

Morning All - sorry have ot keep this short -

ETI - will rise soon - or I'll eat my hat /scarf / shoes etc.

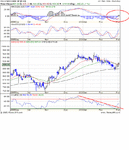
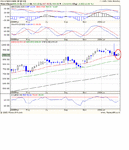
Charts are starting to show buy signals, momentum, macd, rsi etc - will wait for the price to cross the 22 ex MA - and will buy on the pull back - checking with force index etc. By this point the weekly macd will be starting to rise.

Poor charts - but you'll get the idea -


( For any Dr.Elder fans - I have found that Williams %R set to 5, acts virtually the same as force index (2) (draw a line at -50, this equates to the zero line on force index ), not sure if that is any use to anyone else. small divergences can sometimes help with entries.

Rex
 

Attachments

  • ETI daily.gif
    ETI daily.gif
    31 KB · Views: 508
  • eti weekly.gif
    eti weekly.gif
    26.2 KB · Views: 512
This popped up on my radar too. Although it's taking a back seat from my attention. The markets are full of good setups but I'm not sure how long this is gonna last. I've got about 20 stocks that I'm ready to make a move on. These are honed down from a list of about 100! LARD has really caught my attention on Friday. I've entered several traps for Monday all on stocks where i believe a certain price confirms the next bullish move.
 
Rex and Techst.
Nice to see you both posting again on this thread,its been very quiet lately.

Any way,I would like your opinions on settings for Stochastics.I am currently using Elders recommended setting of 5%K - 3%D with 3 periods slowing,from Trading for a Living

Rex I notice from your chart you are using 5-5-5 stochastic settings,Why are you using these and what do you recommend I use to give me reliable trading signals

I am using Macd and 13 and 26 weeks EMA's on weekly charts and 13- 22 and 50 EMA's on the daily charts.I am happy with the EMA and MACD settings but have been playing with the stochastics and cannot make up my mind the best to use.

Regards Jon
 
Sorry mate can't really help yah here, I rarely use the stochastics these days, I still find price the most reliable trading signal. I use the macd to show me when a stock becomes oversold. I'll then use price with a stock closing near the day's high. I may take a quick peek at the stochastic's after checking support, resistance, volume, my EMA's and the candles.
 
techst said:
Sorry mate can't really help yah here, I rarely use the stochastics these days, I still find price the most reliable trading signal. I use the macd to show me when a stock becomes oversold. I'll then use price with a stock closing near the day's high. I may take a quick peek at the stochastic's after checking support, resistance, volume, my EMA's and the candles.

Thanks for your reply.
Interesting,have you changed your trading methods from the Elder Triple screen method.?
 
Not really, I haven't changed the concept of the system completely. I just use the concept in different ways. For example. I plot the 12,26 Weekly EMA's roughly on a daily chart as the 70-130EMAs. These areas are still marking an important area for a stock but i just view it on the daily as well. But I'll also scan stocks using weekly MACD's to look for moves like BT-As recent surge and the huge return of strength that we've seen in the banks and life assurance/insurance and other finance sectors since the latter part of last year. I think it's important not to be changing your parameters like EMAs, MA's ,indicators etc because what your really learning here is about price. And if you keep changing your settings your going to be viewing price in different formats. I like to keep the indicators fixed so that the price moves behind my settings or my market 'lense' as Schwager once pondered. Slow Stochastics has become less important for me as I've learnt and practiced the type of entry that i find profitable. So, I know what i want to see before i enter, and so I need a short term indicator like the stochastic less and less. I hope this makes some sense to you! Because it's hard to explain but makes perfect sense to me, ....probably only me though.

I the triple screen method is a great starting for any trader. But i found that it is only a starting point, reading other books and work on technical analysis and piecing things together to come up with something that works for you. I can also see how this method ties in with other theories and trading concepts. For example looking at Dow Theory which states their are 3 trends happening all at one time, the 13-15EMA's or short term ema's track the theories short term trend. then the 70-130EMA tracks the intermediate as does a daily MACD. Looking at Stan Weinstein's Weekly 30MA which signals a 'continuation buy' point which is along the same lines as an intermediate correction level.

This is all just techncial analysis, then of course once your in a trade you have to manage it effectively but not micro manage it.
 
techst said:
Not really, I haven't changed the concept of the system completely. I just use the concept in different ways. For example. I plot the 12,26 Weekly EMA's roughly on a daily chart as the 70-130EMAs. These areas are still marking an important area for a stock but i just view it on the daily as well. But I'll also scan stocks using weekly MACD's to look for moves like BT-As recent surge and the huge return of strength that we've seen in the banks and life assurance/insurance and other finance sectors since the latter part of last year. I think it's important not to be changing your parameters like EMAs, MA's ,indicators etc because what your really learning here is about price. And if you keep changing your settings your going to be viewing price in different formats. I like to keep the indicators fixed so that the price moves behind my settings or my market 'lense' as Schwager once pondered. Slow Stochastics has become less important for me as I've learnt and practiced the type of entry that i find profitable. So, I know what i want to see before i enter, and so I need a short term indicator like the stochastic less and less. I hope this makes some sense to you! Because it's hard to explain but makes perfect sense to me, ....probably only me though.

I the triple screen method is a great starting for any trader. But i found that it is only a starting point, reading other books and work on technical analysis and piecing things together to come up with something that works for you. I can also see how this method ties in with other theories and trading concepts. For example looking at Dow Theory which states their are 3 trends happening all at one time, the 13-15EMA's or short term ema's track the theories short term trend. then the 70-130EMA tracks the intermediate as does a daily MACD. Looking at Stan Weinstein's Weekly 30MA which signals a 'continuation buy' point which is along the same lines as an intermediate correction level.

This is all just techncial analysis, then of course once your in a trade you have to manage it effectively but not micro manage it.

Techst.
Thanks for taking the trouble to explain your trading method in such detail.
From your posts,I understand you have been using the Elder triple screen method for some time now,even though you have have modified his methods,to improve your trading.
I am pleased to see that you are still using his methods in this way,because I have only been using it since about Dec 05 and Its nice to have confirmation that the system really does work.

I have read several books on TA and charting and It was not until I read both Elder's books that I realised, I needed to construct a planned method for selecting trading opportunities.
I am now using his method as a framework together with some other trading set ups
and this has helped me to stop making so many stupid trades.
I am using trend line breaks,Elders EMA's and MACD,1-2-3 set ups and supp and resistance to name a few and am trading the FTSE 100 stocks, not the FTSE 250 yet.
Hope you keep posting Regards Jon.
 
Glad it's going well for you Fluke,

going back to to the stochastic question - i can't really remember why I'm using 5,5,5 - i saw it somewhere else and tried it - i liked it , so it stays for now until I don't need it - (it's still fairly early days for myself - and I like to see confirmation from a few different indicators on my daily charts).

I think Techst@ is well ahead on that score


as for Elder methods - i think they have steered me in the right direction - I have no doubt they work very well - but I haven't kept to his rules exactly, I keep adding, changing tweaking things. i think his intention was to explain a method of trading - choosing the tools is down to yourself. Don't get me wrong it's early days for myself - so I should exercise some caution with my comments.


anyway - i few messages back i mentioed ETI - entered this morning - and it took off well - I think it's got some milage in it - see what you think


I've made the switch to CFD's (today) and am a little unsure of theplatform - which concerns me a little!! Anyway hope it all keeps going well for you.


Rex


(ah - just read your other thread Techst@ after writing this - think I've just said the same)
 

Attachments

  • eti 13 March.GIF
    eti 13 March.GIF
    68.3 KB · Views: 471
Techst and Rex


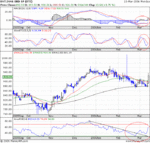
Thought I would post a Sharescope copy of the ETI chart to show another filter I am using.

I use a 2% deviation channel on screen number 1 to show me when the price has fallen to the lowest point of its deviation.This together with the weekly EMA's and MACD helps me to select the shares that are over sold.
 

Attachments

  • ETI.GIF
    ETI.GIF
    20.3 KB · Views: 526
Top