Supply & Demand

BBB's point is highly relevant.
Frequency of trades as well as size is important. Larger numbers of smaller players can squeeze the price of a thin free float stock further and more readily than a lower number of larger size trades.
Movement and volume are closely related, but not all the time.
Accumulation and distribution by professionals can be masked by smaller unobtrusive trades spread out over a longer time period.
Momentum can be created at key inflection points on relatively small volume size by a handful of traders.
In my experience, no one indicator or method works in all scenarios.
Volume, level 2, T&S etc all have their subtleties and none are infallible.
 
ilia king said:
indicators no indicators, level2, price and volume. [...] Different methods work for different people.

Your point is most valid IK.

I think dbp was objecting to Mr. Charts 'superimposing' his method on a thread which dbp believed should have stayed true to his own interpretations.

I believe we all have so much to learn from both that we'd be happy wherever there comments showed up. Interspersed with each others' threads or seperately.

It is all, as you say, knowledge.

Price & Volume and/or price action alone on LII. I'm hooked on both if they serve a purpose - which they do.

As for over-politeness, I know what Chump means and I think that's because we have two strong personalities that are both right in their own realms: each giving a nodding acceptance to the other's knowledge, but unwilling to subscribe to any extent without reservation. It's all a bit academic really.

As fascinating for the pure trading expertise and information as for the human interaction.
 
"believe we all have so much to learn from both that we'd be happy wherever there comments showed up. Interspersed with each others' threads or seperately.

It is all, as you say, knowledge".

absolutely
 
One of the more fatuous sayings on CNBC was "you can't have too much knowledge". FWIW I think knowledge per se is academic overload unless you can somehow separate the odd grain of wheat from the mountain of chaff and make use of it. Take Boards like this and ET - often entertaining but otherwise pretty worthless. EXCEPT that now and again there'll be a sentence (or even a word) that unlocks your own tangential chain of thought and suddenly something falls into place. Doesn't happen often (not to me anyway) but wondrous when it does. Chartman and Skimbleshanks in the past and now DBPhoenix - thanks to you all
 
What comes out of this are 2 things that some folk do not seem to understand although oft stated and repeated in various forms here and in other places.

1 There is no such thing as a free lunch. U may feed free & pack yourself with "knowledge" but do u then have the requisite digestion (wisdom) to fit it together, filter it and then apply it as appropriate - I think not?

2 Wisdom most often equates with life experience and it is rare for this pearl to be given freely. We should savour it and encourage the generosity when we see it. If our time comes we should be generous too. We should also try to be tolerant, concern ourselves less with ego and think beyond the obvious. As my late lamented grandmother would have said "put your words on your hand and look at them before you utter them"

End of rant
 
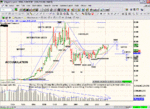
A different chart

I'm tired of seeing charts with 20 zillion lines and numbers on them so I thought maybe it was time to show something a little different. I think shovelling TA on to a chart is to put yourself in the same position as the sheep who is happily head down munching the grass looking no further than the blade of grass under it's nose..so many tasty blades of grass to eat..feeding times over and the sheeps pleased with itself and looks up to find the wolf just about to start dinner....like analogies so use that one to look at this chart. Now if you have no fear and you are not illiquid why would you not want to trade this ?
 

Attachments

  • a different chart.gif
    a different chart.gif
    200 KB · Views: 417
Nice one, chump ;-)
Someone who I actually rate highly (FWTW!) mentioned to me recently that the charts I put up on this site are too simple.
Richard
 
Rog,
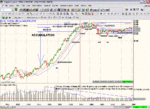
As you requested, a log chart. I've moved it back a bit further so we can get a really good view of the volume...all that volume at all those low low prices .Now look at the distribution area volume circa $45/$50. Now imagine all those people still sat on this stock they bought at $5 to $15 many of who have seen that stock fall back to $20 from $50+....think of those due to retire and have shares in pensions , want to maybe buy a new house ,maybe as inflation starts to bite want to beef up there weekly income ..what are they going to when this stock gets close to the last distribution level $40..they've taken the pain are they now not going to take the gain when it's so close?

Are todays investors going to buy at $40..what with when consumer spending / debt is at a record high ?...take this stock to perhaps be a metaphor for the entire US economy. Until all this past volume washes out from the longest bull market in history (20 years) there's got to be more sellers than buyers at least thats my view and just bear in mind that a lot of those that were doing this buying back over this 20 years are now staring at retirement on the horizon , in their shoes I would I would redirect my capital into a stabler area of investment (bonds)...,but hey as the old geezer in The Stock Operator said "its' a bull market"..LOL
 

Attachments

  • logchart.gif
    logchart.gif
    196.1 KB · Views: 382
Chump
I think my point was to get the timescale into perspective and to better identify support and resistance areas.In my view the log chart is good for this. I also think that over this sort of period a log chart puts the length of bars into context much more clearly. It also fits in imho much better with the observed volume LOL
 
LOL..I would have thought the best support they could have would be to hope they live a long time and don't have to cash in anytime soon
 
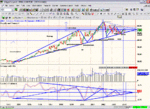
Back by popular demand from absolutely nobody ...LOL
 

Attachments

  • jnjtw2.gif
    jnjtw2.gif
    193.1 KB · Views: 292
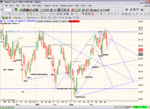
Playing to a packed audience..er...Dell on a much more micro scale to trade than the chart further up the thread......

Rog..Play with the icons a bit..count them...match them....then think about them in terms of deliniating where action over time takes place much as you might look at a market profile that kept adjusting,but still left a prescence.....see what you think
 

Attachments

  • dellt2w.gif
    dellt2w.gif
    194.5 KB · Views: 310
If could work out what madfish used to do with IRT (before I got it) I should be able to crack this
 
"You've been reading Brian J Millard on Channel analysis too LOL"

No, but I will now I know there is such a thing..really I'm not doing anything more than placing lines on paper..what's making the decisions is far more fundamental....the lines just organise it into something visual
 
Top