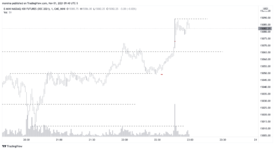
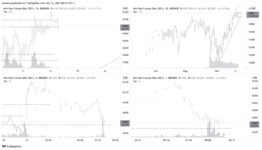
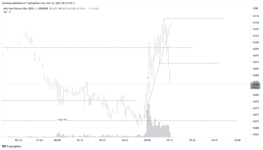
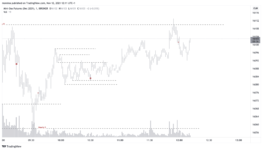
Starting the session at the resistance area formed by the intraday action the day before. The daily seems to have recovered its bullish nature and the 30 minute charts show both intermediate and minor trend to be in a bullish state. As of now, unless we see something significant here, the only trade would be on the long side it it decisively breaks through or if it starts to retrace.

Price gaps up, drops down and take out the latest low, putting the 5 min intermediate trend into question, then rebounds of previous support. At this point it seems that the 5 min has aligned itself with the larger trend and so we go long on the bounce, with our stop loss at 15381.

Price rallies then immediately reverses with significant volume, pushing back down into the resistance area. On the 5 min chart we now have a broken stride, some supply evident from the previous day at the same level, and what amounts to a terminal markup. This is enough for us to close our long position and flip short, with the expectation that price will stop somewhere around 15311. Our stop loss is around the 15436 giving us about 31 points of risk to 94 points of potential gain.
Trades: 1, Losses: 1

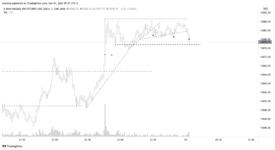
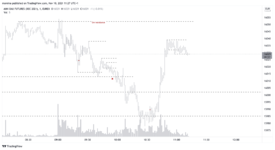
Price drops, forms a high, then a lower low, allowing us to draw our trend line. Price breaks its stride but doesn't come as high as the previous high so we stay in.

Price breaks the previous low and so we draw another trend line. At this point we can also move our stop to breakeven. Selling pressure lets up a little bit later and price then breaks the trend line once again but fails to even come close to the previous high, signalling further weakness. We expect the decline to start picking up steam now. There is also no sign of support anywhere.

Volume starts to increase, signalling the participation of buyers, slowing the decline, then all trading activity vanishes at the bottom, which coincides with the previous daily high. We've had about a 54 point decline at this point from our initial entry and we can now expect price to make some sort of serious effort to rally. We could take our profits here, since the larger time intervals are still bullish and we can now expect the smaller 5 minute interval to fall in line. We choose however to stay in since our trend line is still intact and we don't see any evidence of serious buying on the 5 minute.

Price rallies as expected, gets turned away at the trend line, then forms a higher low just under the trend line. We can expect that even a small rally here would break the downward stride. Coupled with the fact that we have formed a higher low, and we are bouncing off the previous daily high, is enough for us to take our profits and run. We will wait and see if the sell off will continue or if a bullish move will start to appear.
Trades: 2, Wins: 1, Losses: 1, PnL: 10.5 (10.5 points gained for every 1 lost)

Price gaps up, drops down and take out the latest low, putting the 5 min intermediate trend into question, then rebounds of previous support. At this point it seems that the 5 min has aligned itself with the larger trend and so we go long on the bounce, with our stop loss at 15381.
Price rallies then immediately reverses with significant volume, pushing back down into the resistance area. On the 5 min chart we now have a broken stride, some supply evident from the previous day at the same level, and what amounts to a terminal markup. This is enough for us to close our long position and flip short, with the expectation that price will stop somewhere around 15311. Our stop loss is around the 15436 giving us about 31 points of risk to 94 points of potential gain.
Trades: 1, Losses: 1
Price drops, forms a high, then a lower low, allowing us to draw our trend line. Price breaks its stride but doesn't come as high as the previous high so we stay in.
Price breaks the previous low and so we draw another trend line. At this point we can also move our stop to breakeven. Selling pressure lets up a little bit later and price then breaks the trend line once again but fails to even come close to the previous high, signalling further weakness. We expect the decline to start picking up steam now. There is also no sign of support anywhere.
Volume starts to increase, signalling the participation of buyers, slowing the decline, then all trading activity vanishes at the bottom, which coincides with the previous daily high. We've had about a 54 point decline at this point from our initial entry and we can now expect price to make some sort of serious effort to rally. We could take our profits here, since the larger time intervals are still bullish and we can now expect the smaller 5 minute interval to fall in line. We choose however to stay in since our trend line is still intact and we don't see any evidence of serious buying on the 5 minute.
Price rallies as expected, gets turned away at the trend line, then forms a higher low just under the trend line. We can expect that even a small rally here would break the downward stride. Coupled with the fact that we have formed a higher low, and we are bouncing off the previous daily high, is enough for us to take our profits and run. We will wait and see if the sell off will continue or if a bullish move will start to appear.
Trades: 2, Wins: 1, Losses: 1, PnL: 10.5 (10.5 points gained for every 1 lost)
Last edited:

