-oo0(GoldTrader)
Well-known member
- Messages
- 345
- Likes
- 5
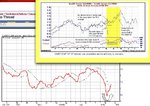
The only thing that is obvious to me is that the seasonal chart was right on. The low occurred within a day or two as predicted. Do you see what the “five-year,” is going to have to do in order to “average,” the “fifteen-year,” over the next ten years?ERA said:I have attached Moore's AugCrude05/Febcrude06 spread to illustrate.
I also choose this spread because frankly it is going T!TS up at the moment.
The 15 yr gives a good average overview of how the spread has performed. The 5 yr gives a good view of how the spread has been changing in character from the longer average in recent years. That is obvious.
My guess is even though the six-week uptrend starts the first week in April. The reason the window opens were it does is to catch the low, which occurs when the season changed to spring. It is the rise off of this seasonal low, that lets you build up a big position with very little starting capital.
It does not matter much what happened in February. That is out of the highly likely area. What matters is what it is doing now, in the seasonal window.Back to the trade at the moment. Looking at the crude spread it followed the seasonal average very well until the last week of Feb,
I do not see any counter seasonal trend here. This is a tradable spread.correlation since then it has been in a steady counter seasonal down trend,
Parobolic turned today.with no logical long entry,
The definition of a wash out is everything pointing down. Now we have a trendline break, Parobolic, divergences etc. everything signaling the spring bottom is in on schedule!everything is pointed down, indicators and price action.
Common sense in not very common.common sense are needed.


