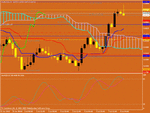
Some of my trades, forecasts

Status
Not open for further replies.
Hi Paul
well eur and chf are closely inversely correlated - so are unlikely to move far unless something upsets that - intererstingly in recent days the correlation has broken down - apparently due to heavy moves from euro funds into swiss francs and SNF intervention. eur gbp tends to move slowly because euro and gbp generally respond in a similar way to dollar and stock market moves - but again in recent weeks this pair has shown an unusal amount of movement - and in some cases has seemed to dictate the movement on GU - I understand because bankers have moved into eurgbp tp hedge their positions on the majors
GBPJPY does not move as much as it used to becuase of the dramatic fall of the pound against the yen - pound don't buy much yen anymore
taking a look at your pivot levels - I assume that your YMWD pivots are all worked out on the same basis
finally the movement on audusd today; was this foreseen - I seem to recall that you were calling for this pair to fall - anyway look forward to the next instalment
 
Re: USD/CHF trade update

Dave, we did dissent along one line. I did not go long the swissy. This is because the monthly looks very bearish. There is still further to go on the weekly. I just don't trust a long at this point, even though odds are we'll get the bounce at my MS1.


Maybe I should quit reading your thread...LOL...I bought it at 1.0520 because my target was the 1.0510.... Once again EW and IC...
 
reading your blog about RSI - this is true - but also true of stoch - in a strong trend, it will stay OB/OS for a long time and a new twist in the ss is usually a sign to reenter the trade - but yes RSI reading over 70 - especially on a shorter term rsi such as 5 is usually a good sign to add or enter
 
Exactly, the EUR/USD * USD/CHF = EUR/CHF. So, if they are moving correlationally the same, then the EUR/CHF is not moving. Lately, the USD/CHF has been racing down the hill faster than the EUR/USD has been going up, so the EUR/CHF has also been pummelled.
You're right on the cable and euro. Of late, daily range for the euro is 134 pips, adn cable is 160. 134 / 160 = .8375. Current price as of this writing is .8320. The slight diffeence adds to 80 points per day, which is the daily range, lately of the EUR/GBP.
I like your Accounting mind. Daily range of the USD/JPY has been 120. 160 / 120 = 1.33. GBP/JPY is currently at 133.19. When it was well above 200, it was moving much faster for the exact reason you said.
BTW, my cousin Nicolas, lives in Cornwall, and he too, has an Accounting background.

Hi Paul
well eur and chf are closely inversely correlated - so are unlikely to move far unless something upsets that - intererstingly in recent days the correlation has broken down - apparently due to heavy moves from euro funds into swiss francs and SNF intervention. eur gbp tends to move slowly because euro and gbp generally respond in a similar way to dollar and stock market moves - but again in recent weeks this pair has shown an unusal amount of movement - and in some cases has seemed to dictate the movement on GU - I understand because bankers have moved into eurgbp tp hedge their positions on the majors
GBPJPY does not move as much as it used to becuase of the dramatic fall of the pound against the yen - pound don't buy much yen anymore
taking a look at your pivot levels - I assume that your YMWD pivots are all worked out on the same basis
finally the movement on audusd today; was this foreseen - I seem to recall that you were calling for this pair to fall - anyway look forward to the next instalment
 
AUD/USD trade

The aussie hit my MR1 today at .8620, and fell a little short of the WR2 at .8667, so I went short at .8640
 
Re: AUD/USD trade

The aussie hit my MR1 today at .8620, and fell a little short of the WR2 at .8667, so I went short at .8640

The Aussie just hit the .8667 so I went short. It was in a C wave up and I had been waiting on the fifth wave of the C and it made that at the same time it hit the .8667 so I figured if I was looking for that and with your WR2 it must be time to sell.
 
P.S. I thought the the euro would make it close to 1.2700 but it finally did make that last little fifth wave I was looking for as well as the Aussie.
 
Re: AUD/USD trade

Yep, I was wrong on this one, at least for the time being. I'll probably have to take the local on this one to get to where I need to be, but it happens at times.

The aussie hit my MR1 today at .8620, and fell a little short of the WR2 at .8667, so I went short at .8640
 
Re: AUD/USD trade

Looks like some stormy winds blew us the wrong way on this wave. I guess now it is time to be patient. It did run into cluster resistance. DR2 is .8751, and the 61.8% mark of MR1--MR2 is .8746. It will still be an irony if this point is containment. ..8834 looks more viable, which is the MR2.

The Aussie just hit the .8667 so I went short. It was in a C wave up and I had been waiting on the fifth wave of the C and it made that at the same time it hit the .8667 so I figured if I was looking for that and with your WR2 it must be time to sell.
 
Check out my Aussie chart with the mod stochastic. I like to set the MA's up as 21, 5, and 2 on the hour chart and I have a fractal indicator added on top of that (the arrows). If I would have waited for that red sell arrow I would have been good to go...
 

Attachments

  • AUD_07_07_2010_Hour.PNG
    AUD_07_07_2010_Hour.PNG
    25.5 KB · Views: 114
Check out my Aussie chart with the mod stochastic. I like to set the MA's up as 21, 5, and 2 on the hour chart and I have a fractal indicator added on top of that (the arrows). If I would have waited for that red sell arrow I would have been good to go...

BTW, I really did take it at .8667. I just realized that my sold line is on there at .8840 something. I had a stop at .8710 for half my lots so it moved my position when it closed half. Anyway when I get that red sell arrow for confirmation I'm adding some more shorts.
 
Some updates

Well, life is not always a bed of roses. I had an entry order on the EUR/USD that kicked in. Tucker had to go water the flowers in the middle of the night, so I thought I would check, ironically my aussie trade. I found the euro was not impulsive enough, and took it out ofr +9 pips.
The aussie is not only a strong leg, but this monster has teeth. I'm looking at the next overhead resistance, and it is MR2 at .8834. Considering the MR1 was violated, there should be a strong move at .8834. Any spike should be contained at the WR3 at .8879. I hedged the current trade and plan on takiong the hedge out at .8834, and I might add another position on at that time.
As for the euro, it is still struggling around the R area that was mentioned earlier. Seeing I got out of it by the skin of my teeth, I'll be a little more patient. Today's containment should be the DR3 at 1.2743. Ideally, between now and tomorrow, I'd like to see a rise to the daily cloud top at 1.2783.
Cable appears as if it is back on in the DOWN, but don't bet (figure of speech) on it. Strong S is going to be seen at 1.5100. I still maintain 1.5278 needs to be hit, and it is still trapped above 1.5005. Even though cable has been choppy, it has been a little more predictable than the rest, and that is only within the idea of finding the proper S&R's for the reaction that I am looking for.
Needless to say, other than the MT--LT trades that have been closed the total of my open trades are now in the hole, but that's okay. Keep your eye on those targets. They are uncanny.
BTW, the reason I took out the swissy, the GBP/CAD, but did not the EUR/AUD and the GBP/AUD is simply because of the longer term implication involved with those. Swissy and the GBP/CAD were already very close to my targets, adn I did not want to endure the sideways motion of the swissy, and the flat out correction of the GBP/CAD.
 
Richard, if it is 9,26,52, then yes.
I just wanted to clarify that, because there are a few brokers that the standard settings are something different.


Hi Paul

Do you use the standard settings for I Cloud?

Regards
Richard
 
Richard, if it is 9,26,52, then yes.
I just wanted to clarify that, because there are a few brokers that the standard settings are something different.

Yes that's what I meant; I am aware that some believe that those settings are not optimal. A whole nother debate no doubt. lol
 
Re: Djia

This was posted 6 days ago. Notice the sideways action before the latest spike. That sideways action happened after the 10,058 mark was hit perfectly. This is also what I mean about a trend or a correction with teeth in it. No repsect for that area, and just kept on going.
Notice all the resistance over head. The cloud top is 10,159, 200 MA is 10,163, and the MR2 is 10,227.
I do not trade the DJIA. There are 1 or 2 that follow it in this thread, which is why I like to keep you all posted concerning it. Also, it does, once again, show the effectiveness of my S&R's and, of course, the ichimoku cloud.
Another point is that certain key areas may get disrespected, but it is inevitable there will be a reaction. So we can get a view of things futuristically....again, watch for the reaction at the aformentioned levels.
BTW, look at the stochastics. It is implied that the top of the cloud--MA combo is containment for an nice quick short. If that area is not containment for the entire correction then watch out ofr 10,258, which is the bottom of the daily cloud, and would represent a collision course with the very bearish weekly tenken.


It tried but unscuccessfully to break into the weekly cloud today, so instead it acted as support. Now, we can expect a move back to at least 10,058 before the DOWN continues.
 

Attachments

Boiler room scams

Nigsynegs, I saw your other post. You know the old saying, "If it sounds too good to be true, then it is."
 
Got a question

I got what may appear as a stupid question, but maybe someone can help. I got a pic in my profile, but I want it shown in the forum, like many are after they make a post. I think they call it an avatar. How do I do that? All thsi time I spend on a computer, you'd think I'd have this stuff down. Anyway, thanks in advance.
 
I forgot who I had the conversation with, and this thread is too big to dig for it, but we were looking at charts of the aussie, adn his looked totally different than mine. I'd venture a guess is standard settings are different.
I have always used standard settings, for no other reason, than they work for me. Many brokers, I noticed, now have standard 5,3,3 on the stochastics. I still revert back to the 5,5,5. Personally, I have also found the 5,3,3 is too noisy.


Yes that's what I meant; I am aware that some believe that those settings are not optimal. A whole nother debate no doubt. lol
 
AUD/USD....again

Attached is my "A" chart. It is seldom I use my "a" S&R's as an indicator for a reversal. They are effective for price action, but to make a long story short, they are ineffective for containments for reversals. This is an exception to the rule. With the exception of the spike you see the perfect bounce off my MR2a. The move looks impulsive, so this should be it. Another visit to the top of the monthly, weekly and daily clouds also adds fuel to the fire.
I was hoping to find a spot to add a 2nd position after taking out my hedge, but that has not worked, so far.
BTW, the hedge was canned for -43 pips, but I'll report the total net of the trade once I close the short.
 

Attachments

  • audusd short.gif
    audusd short.gif
    26 KB · Views: 154
Status
Not open for further replies.
Back
Top