dbphoenix
Guest Author
- Messages
- 6,954
- Likes
- 1,266
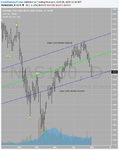
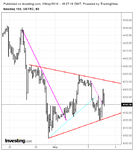
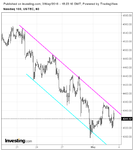
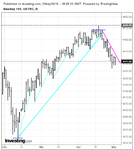
How do you apply the W and D lines to 1 minute or seconds charts to enter a trade?
Do the trend lines that are drawn on the D and W charts correlate with the lower time frame charts to enter an intraday trade?
I'm trying to figure out how to piece it all together? Do you utilize the SLA on the D, W and Hourly charts to find key levels? How is it applied to the 1 minute and seconds charts?
Trends, trendlines, and channels are addressed in all three sections of the book. I suggest beginning with pp. 39ff in the SLAB. "Trading Opportunities" in Notes will also be of interest. Then of course there are the posts in this thread.
Db


