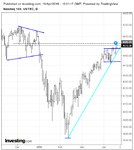
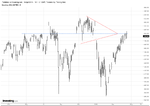
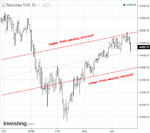
Since my last post price spent most of the week churning around the upper limit of the range I posted without really making any progress to the upside. Thursdays close saw price give up and drop off to the mean where it spent the overnight session ranging.
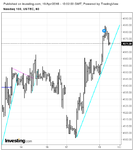
Despite an opening BO there was no entry ret and price returned to the range, the BO did not happen until 40 minutes after open and one would have to be quick as it happens fast, which is what one wants to see with a BO.
The point of interest is the first break of stride, given what one believes is the most probable direction of price from the hourly what does a trader do at this point?
Stride break = 15 points, Stride break + 3 = 12 points, the trade is over and one turns their attention to looking for a long and might miss the re-short.
The other options are the swing point break which in this case was 3 ticks, is it enough to constitute a break? Or one could look at the depth of the ret, which was exactly 50% from the swing high at entry 2.
If price put in a higher low that would have been something else to consider, but, if one could have rode it out they would be looking at a 30+ point trade within an hour.
The bigger trades will often hit a bump or two along the way.
I'm responding to this here because the SLA thread is about the pdf, and the pdf doesn't get into intraday trading.
You know to begin, always, with the weekly. The weekly is in charge. The weekly provides the framework. However, in order to make the best use of it, one must regard all of it, which is why I made my last two posts here. Taking only a snippet of it, as you did in your next-to-last post in the SLA thread, is no different in practice than plotting the hourly and zooming out. The weekly provides the context. The weekly provides the LOLR.
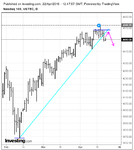
So back up to the weekly trend channel and look for your TOs. The most recent TO for longs before last Friday was April 12, when price bounced off the median of the channel. Though there would be both short and long ops for the intraday trader thereafter, the LOLR would remain up. Price then approaches the UL the next session and hits it repeatedly over the next three. The turning point comes on the 19th when it reaches a slightly overbought condition. It then falls toward and bounces off the LL of the channel after a slightly oversold condition, which is why I posted my earlier charts.
The weekly provides context and direction, the LOLR. If one does not give it its due, he will spend a lot of time looking at the trades he should have taken but didn't.
You know that if the only tool you have is a hammer, every problem looks like a nail. If you focus on ranges, then every op for which you look will be sought in the context of a range, and the range is nothing more than a state of equilibrium. Waiting until price reaches the UL or LL of the range, much less breaks out of it, is time and opportunity wasted.
Looking at Friday specifically, the session is preceded by a plunge the previous afternoon which segues into a range overnight, eventually settling into 4502, where buyers are no longer willing to buy, to 4482, where buyers begin to accept the asks. Given that the NQ awakens at about 0300 NYT, these limits carry some significance. This lasts until 0900, when price drops to 81 and forms a hinge at 82.5 (you'll have noted how 81-82 keeps popping up; this is the true meaning of "pivot"). Then price drops 11pts. As explained in the book, price will often make equivalent swings either side of these apexes, giving an upside target of about 94. As price reaches this level, he looks for weakness and failure on a tick chart, assuming he is not already short, e.g., 0715. If he uses the 10s, he'll see a RET at 093720. Little of this -- or none of it -- is seen if the focus is on ranges.
I go into this detail to emphasize the point that if one is going to daytrade he must do it every day, and by "do it" I mean post his prep for the session, trade the session, post a chart review along with his real-time notes, post what he did right that he wants to continue doing, post what he did wrong and why and what he intends to do about fixing the problem, then pack it all away until the time comes to do the prep for the next day. If one does not do it every day, then he loses the rhythm, and his trades become more or less random. The occasional daytrader will not succeed. He needs instead to find an interval that enables him to focus on what he needs to do in order to succeed, most likely the daily.
As for your charts in particular, it will help if you include prices and volume in them.
Db

