SLAyers' Notes

Status
Not open for further replies.
Actually, as I pointed out in post 235 (and added to the book in somewhat expanded form), one ought to be monitoring the longer intervals even if he is trading a 1m or 5m chart as the longer intervals are where The Money is, and the people with the money aren't dicking around with 1m charts. If the daytrader sees price being bound in ranges in longer intervals, he can expect chop. If he wants to scalp, fine. If he doesn't, then he needs to stand aside and wait for Money to move. If Money has already left for the holiday, then it's time to load "White Christmas" and relax.

Db
 
.
 

Attachments

  • Image14.gif
    Image14.gif
    26.1 KB · Views: 178
  • Beginner's Guide, p1.gif
    Beginner's Guide, p1.gif
    316.1 KB · Views: 398
  • DemSup.gif
    DemSup.gif
    197.9 KB · Views: 315
  • DetTrnd.gif
    DetTrnd.gif
    237.2 KB · Views: 298
Last edited:
The "Origins of SLA" is an eye opener for those who go through Section 7 and then look at it. If one can't see the value of information synthesis and simplification of so much detail, of all that came before, into the "Origins", then that person is better off looking elsewhere. For those who do understand its value, it's a wonderful reminder of simplicity and elegance, not unlike E=mc^2 is for energy and mass conversion.

Gringo
 
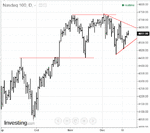
As I've said before, those who populate forums such as this one are usually desperate to daytrade, even though they are not in a position to do so: they're working, they're on the road, they're in class, etc. They are therefore pretty much doomed from the outset. So, given that nobody is daytrading this, I'll stick with the dailies and hourlies, in this example the dailies.

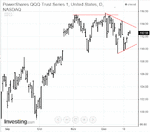
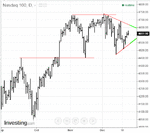
This is what we're looking at today, in preparation for tomorrow. And the first question, usually, is going to be "where do I enter?"
 

Attachments

  • Image1.gif
    Image1.gif
    19.1 KB · Views: 177
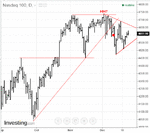
However, if one were trading daily charts, as he should, he'd already be in. If he had viewed that little blip at the beginning of December as a higher high, he'd be in at the red dot:
 

Attachments

  • Image15a.gif
    Image15a.gif
    19.9 KB · Views: 189
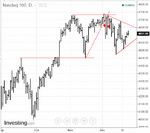
On the other hand, if he had been short off the break of the SL after the first high, he'd see this second attempt as a trading opportunity, a failure, rather than a higher high, draw his DL differently, and enter earlier (his choice of entry here would depend on how "aggressive" he is):
 

Attachments

  • Image15b.gif
    Image15b.gif
    19.4 KB · Views: 181
Last edited:
Either way, given that neither the SL nor the DP has been breached, he'd still be in.

Few traders who are trading with real money, however, are going to be able to tolerate this sort of risk. Therefore, I suggest to those traders that they translate all of the above to the Q. The risk is far less, and one needn't to resort to forex simply because it seems "cheaper".
 

Attachments

  • Image1a.gif
    Image1a.gif
    18.8 KB · Views: 145
Either way, given that neither the SL nor the DP has been breached, he'd still be in.

And for those who for whatever reason are not in, the next trading opportunities will occur when price hits either of the green zones. Until then, you're in chop (note that we're sitting dead on the apex of that hinge).
 

Attachments

  • Image15e.gif
    Image15e.gif
    19.3 KB · Views: 199
The business about the book and about being a vendor comes up regularly, like last night's chili. Why the book? A participant in one of my forums put it succinctly:

Eventually, everything that has to be said is said. The same questions are asked again and again, the same theories are explained again and again, the same or similar examples are provided again and again. Hundreds of threads with repeating subjects, the old threads having hundreds of pages with repeating questions, the result of which is that newcomers become easily confused and what is important becomes more difficult to find, even with Search. At some point, rather than add value, further postings just add mess.

And, so, the book. Topics addressed, questions answered, examples given. But only enough. Not endlessly. I hope that those who understand the need for assuming the responsibility for one's successes and failures will find it useful, will catch the ball and run with it. The spirits of those who came before will be there to cheer.

Db
 
Speaking of the book, I was going to add this before I sent out the "finished" copy, but while some might find it invigorating and inspirational, others might take it as a bummer, and that's not a note on which one ends a book on trading and investing. This sort of thing requires discussion, if any choose to do so. But whether any discussion takes place or not, this needs to be said.

For the remainder, see the attached pdf.
 

Attachments

Speaking of the book, I was going to add this before I sent out the "finished" copy, but while some might find it invigorating and inspirational, others might take it as a bummer, and that's not a note on which one ends a book on trading and investing. This sort of thing requires discussion, if any choose to do so. But whether any discussion takes place or not, this needs to be said.

For the remainder, see the attached pdf.

Oh great ! That's all I need !

I'm almost tempted to take 10 students on a trading journey.
The problem is....it would be a journey like no other they have taken.
 

Attachments

  • mods.PNG
    mods.PNG
    6.2 KB · Views: 136
And for those who for whatever reason are not in, the next trading opportunities will occur when price hits either of the green zones. Until then, you're in chop (note that we're sitting dead on the apex of that hinge).

211146d1451241382t-slayers-notes-image15e.gif
.
 

Attachments

  • Image10.gif
    Image10.gif
    23.6 KB · Views: 215
No interest so far in the charts I posted here a couple of days ago: the NQ, ES, DOW, FTSE, CAC, DAX and even the EUR/USD. It's disappointing to see so many people guessing when trading deliberately and methodically yields superior results, but there you are. But I'm not going to move the charts here. That's what links are for.

Otherwise I'm repeating a copy I made of a post elsewhere because what it has to say is important to SLAyers. It didn't get much attention either, when it was originally posted or when I copied it, but there you are again:

A Plan that doesnt include contingency for the market going against you isnt a plan, its a disaster waiting to happen. It is worse than no plan.

A plan isnt "I will review my positions at 6pm each evening" or "I will only risk 1% of my account on each trade" or "I will follow my trade rules"
Those things are mental masturbation.
Things like that get in the way of planning a trade, and give a false sense of security.

A plan goes a lot more like
I am long if price gets down to 1.0000
If price closes below 0.99 I will reduce lots and normalize risk, while i wait for price to close back above 1.00 or show that it is unlikely to close back above 1.00
If price closes above 1.05 I will add lots, normalize risk, and lock in some profit by doing so.
If price gets to 1.10 the trade is over. I will reallocate profit as either more leverage or less risk.

there are, of course, reasons for choosing those numbers, they arent just plucked out of the air.


The thread, and first post, may be found here (*click*).
 
I sent out a bunch of copies of the new, improved Trading By Price yesterday to those who had bought the old, unimproved version. I hadn't realized the worldwide interest in this, every continent but Africa and Antarctica. Biggest in Asia, for some reason, perhaps a different work ethic. I mention it only to point out that those few here who are interested in this are not alone.

Keep on truckin'.

Db
 
Re the post four up.

Price reached the top of the hinge a half-hour ago.

What interval do you want to trade?

What's the DP?

How much risk can you assume?

0925: PS. Keep an eye on 41.25.
 
Last edited:
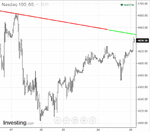
I realize that no one is daytrading this, so I won't go into all that. If however one is trading a longer interval, e.g., daily or hourly, it is important to focus on what other daily and hourly traders are looking at. The weekly chart I posted Saturday showed that we were testing the lower limit of it, around 4630. Two days ago I posted the hinge on the daily chart and pointed out that the trading opportunities were most likely to take place if and when price tested one or the other limit of that hinge. The trader who plotted a weekly chart last week and a daily chart over the weekend would have given himself plenty of notice that 4630 and 4650 were levels of interest. Or he could just look at mine.

This morning he'd see that price was passing through 30 at 0300NYT and testing it at 0645NYT. When the DL held, next up was 50. If one was watching price (and given the notice he had received or had found himself there was no reason he wouldn't have been watching price), he'd see price test 50, pull back to 39, then push toward 50 again, breaking through and working its way up to 4700.

The risk in this trade was minimal, 5 or 6pts at most. If one was there. And given the amount of notice, there was no reason he wouldn't be. If he wasn't, he'd best think about why.

Db
 
Status
Not open for further replies.
Back
Top