cable also 'in' area of interest
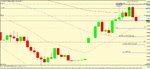
4H chart from yesterdaygbp 1.56 50 - 1.57 50
Last edited:
4H chart from yesterdaygbp 1.56 50 - 1.57 50
Order placed to short @ 1.00 25, being 50% of the 4H shooting start just closed (H 1.00 80, low @ 0.99 72) a 105 pip risk which is too big for meOzzie has powered into the 50% / 61.8% retracement area
Order placed to short @ 1.00 25, being 50% of the 4H shooting start just closed (H 1.00 80, low @ 0.99 72) a 105 pip risk which is too big for me
Anyone else unable to load their charts to T2W this week 🙁
Now I am sitting back to see if my order gets filled...
One to watch next week for any signal to trigger a new 'up' leg
I try to avoid the 'should-a, would-a, could-a' but this is frustrating, my stop was hit because it was 6 pips too tight, now up 100's of pips!it would be against Fridays very bearish candle. So I am not looking to re-enter this pair at present
Price has retraced 50% of the last 4H up swing, so daily & 4H timeframes remain long, this 'should-a' been my 'add to' signal, so attempting a buy from the hammer printed on Friday (which I hadn't noticed until now). Looks like tested the level again, to form a double bottom and print a bearish outside bar signal?I try to avoid the 'should-a, would-a, could-a' but this is frustrating, my stop was hit because it was 6 pips too tight, now up 100's of pips!
If price touches 83.80 I'll move my stop to breakeven
Stop taken out and then price reversed after a new 4H signal at the 61.8% retracement levelPrice has retraced 50% of the last 4H up swing). Looks like tested the level again, to form a double bottom and print a bearish outside bar signal?