S/R and the Mirror of Erised

Posted elsewhere:

Everyone says it: "Keep it Simple, blah blah blah..."

But no one tells us how to keep it simple. If it was that simple, then why doesn't anybody tell us about keeping it simple. Would it be that hard?


Lots of trading magazines and books have already told you that. They tell you to keep it simple by not overcomplicating things with indicators, etc, and if you read enough of them, it all comes down to price, time, and volume along with the basics of stop loss, risk management, etc.

That is the concept, and that is THE SIMPLEST FORM that anyone, including your mentor, is able to tell you. Don't expect someone, including your mentor, to tell you when to buy and when to sell without experiencing the market yourself and further enhancing yourself. Your mentor can tell you so much with trendlines, S/R , or once x setup happens, then price most likely will go up or down. The market changes and can go against you anytime. After you experience the market and actually trade to a point/level of breakeven, you will know how simple -- but not easy -- the market action and trading is.

It's almost like the game of baseball. I tell you it's a simple game. All you do is just hit the ball by swinging the bat when the ball is coming at you, especially a fastball which usually comes in straight and fast, about 95mph, and this pitcher is usually going to give you fastballs. So with this knowledge, you think it's easy and step up to the plate with confidence. Then the pitcher does throw a fastball ball to you. From your perspective, it seems to be coming in at 95 mph. So you take a big swing, but by the time you swing the bat, the ball has already whizzed by you. Sorry, you misjudged it because the ball was coming in at 99, not 95 mph. Could've hit a homerun or extra base hit if you had swung at it a split second earlier.

Then on the next pitch. You are sitting on a fastball, and this time you swing a bit earlier than last time. But sorry, this time you swung too early; the ball is NOT coming in at 99 mph, but at 91 mph, and at a slightly different location. But hey, it's still a fastball. Why did you miss it!??

So you, getting pissed off or a bit pressured and scared, are now waiting for the next pitch, perhaps your last one. This time you will try to time it correctly. The pitch comes in. Ah, it's a slower one, going at about 85 mph. You wait a bit and swing perfectly at the perfect time. But still nothing. The ball drops down suddenly and you are left with nothing but swinging at air. The pitcher (market) psyched you out with a nastly sinker. You lose.

Hey, forget the last pitch, but you had 2 chances to hit a fastball. I even told you he is going to give you fastballs, and I told you the behavior of a fastball a thousand times. But why did you miss it? It's so simple!?? It's direct and it's fast, but watch the speed and also the location where it's about to be. If it's outside your reach, don't swing. If it's within your reach, swing at the location where it's coming in. That's it! See, it's simple, and that's the simplest form I can put it in. Don't understand why you still can't hit the ball!

Hope you get the point.

--bwc
 
The purpose of this thread -- the process of plotting S/R in prep and in real time -- has had something of a timeout. Since no one has stepped up to play with the charts in posts 1, 3, 4, or 10, I'll go through the first set myself. Those who are interested in this can then play with the charts in 3, 4, and 10 if they want to. Having post 5 at hand will be helpful.

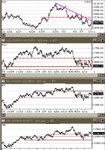
The first chart, or set of charts, establishes the context. Both the ES and YM are sitting on S/R, so the day may end up being important. But that, fortunately, is not the concern of the trader. The daily chart of the NQ is also at S/R, but at a lower level. There's no buffer here. The intraday NQ chart at the top shows a down-sloping supply line and a price that's below relatively important R at 1570.

The second chart is the previous day's chart. Given the number of times that 1550 and 1555 been tested, and given price's behavior when it has broken through those levels, these two levels are likely to be important. 1555, however, is "soft". Price has popped up to 1556 and 1557, and there's a swing low at 1558 with congestion following, so the trader can elect to allow price to confirm R at some level after the open.

The third chart is the first chart of the trading day. Price has opened between the two S/R levels. Price pokes above 1555 but quickly chokes. This sets off a yellow light. If the PD's SL and congestion at this level haven't been noticed prior to the opening during the prep phase, the trader should look to the left here in order to determine whether there is anything back there that is important. There was.

Now the trader observes price to see how it reacts to all this and sees that it drops to the pre-opening low, which is also at the PDC's high. The level is tested again almost immediately, further confirming its importance.

Price then makes another rally attempt, hitting the OH, adding further confirmation to the importance of this level (of course, if this level hadn't been tested at all this day, much less twice, there would be no reason to bother with it). Price is turned away again, finds S at 1551 +/- again, then plunges to 1548. Here is stalls, prompting the trader to again look left if he had not done so already in prep. There he finds another congestion zone prior to the PDC, but this one is below 1548 (there is also a swing point here at the PD's open, but that in itself is only tentatively important).

At this point, price rallies back into the original S/R range and there is greater clarity as to what are important levels of S and R.
 

Attachments

  • Image2.jpg
    Image2.jpg
    94.6 KB · Views: 431
  • Image3.jpg
    Image3.jpg
    32.2 KB · Views: 382
  • Image4.jpg
    Image4.jpg
    42.9 KB · Views: 399
By now, it is clear that the move back into the OR is more than just a poke. Price has moved decisively upward and is now at the OR midpoint.
 

Attachments

  • Image9.jpg
    Image9.jpg
    45.1 KB · Views: 388
Price stalls at 1553 and prompts a new, tentative R level. It then pulls back a bit (literally), makes a lower high (just barely), then falls to and through S at 1550.

Using this particular display, the "lower high" is probably trivial (though it may not be for someone trading a tick chart); it does suggest, however, that 1553 might be important later. What matters more in real time is that price drops through S and returns to the next S level at 1548.
 

Attachments

  • Image10.jpg
    Image10.jpg
    44.7 KB · Views: 384
Price drops further to 1546. This coincides with the PD's LSL as well as the top of the congestion which occurred that afternoon after 1500 and a line can be drawn there so that this is not overlooked (the line could also have been drawn earlier; depends on how "clean" one wants his chart at the open). Technically, this drop to 1546 constitutes a LrL thus defining a downtrend. However, it may also be a fakeout, so one can wait if he chooses to do so.

Price bounces off 1546, making that level at least somewhat more important, then reaches back to 1549. The recoil here is only three, for now, whereas the previous recoil was five.
 

Attachments

  • Image11.jpg
    Image11.jpg
    45.8 KB · Views: 368
Price drops below 1546 to 1544, the bottom of the congestion zone previously noted. It recoils less than two points, then drops below all pre-plotted S levels to 1541 (1542 is both the PDL and the PWL).

At this point, the LrLs are not in doubt, so a supply line/trend line can be drawn. Price rallies above this line and above the LSH, a technical trend reversal.
 

Attachments

  • Image12.jpg
    Image12.jpg
    50.2 KB · Views: 348
Last edited:
Price rallies almost to R at 1548, but then retraces to 1545, below the LSH, and waffles around there for a while. Given that price is at the LSH rather than above casts some doubt on the legitimacy of the trend reversal.

The extent of the rally may represent R. This proves to be the case when price rallies back to that level. Even though it tries several times to break through, it's turned back and drops below the reaction low of 1545. The previous congestion at that level may account for the "plunge" below 1545 to 1543. Price recoils quickly, but pauses dead on S. Even though there is now no trend reversal, the trend remains broken.
 

Attachments

  • Image13.jpg
    Image13.jpg
    50 KB · Views: 336
Price now resumes its descent, pausing at 1540, then continuing on to the ADR at 1538. Given the new low, a new TL can be drawn, but there's really no point in doing so. Down is down.
 

Attachments

  • Image14.jpg
    Image14.jpg
    52.4 KB · Views: 313
Price consolidates at the ADR for quite some time, enabling new S/R levels above and below, then falls out of it sharply, arcing into 1534. Given the LrL, a supply line can be drawn for this segment of the downtrend.

Price consolidates again at 1534 creating possible S, then rallies back toward previous S/R. It doesn't quite make it, but repeatedly bangs against this level, making new and potentially significant R.

Price eventually gives up, drops through S at 1534, and works its way toward 1530.
 

Attachments

  • Image15.jpg
    Image15.jpg
    55.2 KB · Views: 349
After bouncing around a 2pt congestion zone at 1530, price breaks through the 1530 level to 1527, then rallies back toward 1530. It doesn't quite make it, but 1530 becomes the level to watch.

Price then resumes its decline, reaching 1526. Here it rallies back to 1528 where it consolidates long enough to "break" the supply line. It then rallies further to S/R, then through, then to the top of the congestion at 1530. A slight retracement, then a further rally toward S/R at 1534, and while there's no clear "swing point", clearing that congestion level might qualify as a trend reversal.

Price consolidates here, falls back a bit, then rallies all the way to S/R at 1534 where it remains until the close.
 

Attachments

  • Image16.jpg
    Image16.jpg
    41.1 KB · Views: 415
As we all know, it is very difficult to change the long established habits that were inculcated in us when we were quite young. People will fight to defend old maps and old symbols, regardless of whether those maps actually represent any territory here and now, and regardless of whether they ever did represent just what we were told they represented.

Even when people take their map and go to the territory and compare them and note the changes or corrections the map needs, they will still cling to the old map, so much so that even when these realities have demonstrably changed, or are provably different from the "map", they still tend to deny the external reality and assert the "truth" of the map.

Is it any wonder then that there are contradictions among the views of various stock market analysts, if they are each clinging to a simple all-out view and for all practical purposes ignore anything that does not support the view they hold already? There are no contradictions in reality, you know. If we can just look away from the high abstraction long enough to see the facts, we find no contradiction.

If we value the map more than the reality, we must not be surprised to find that the reality doesn't always fit the map. In such a case, the reasonable man will change his map, not try to explain away the facts.

-- John Magee
 
Hi, thanks for this great thread. I have been trading price on and off for some time now with a decent amount of success in forex 5min. I don't have the link but in one post someone mentioned just "watching price" for the day. I find this invaluable as you can start to understand what is effecting price and how it will react over time, not wow these 3 indicators are doing this so I have to sell. I also find looking at price over several time periods invaluable.. Anyway, my question is do you think i'm wasting my time on 5min fx charts with no volume etc or should i continue until i can get a decent index trading platform? Is volume that important?
 
jackjones said:
Hi, thanks for this great thread. I have been trading price on and off for some time now with a decent amount of success in forex 5min. I don't have the link but in one post someone mentioned just "watching price" for the day. I find this invaluable as you can start to understand what is effecting price and how it will react over time, not wow these 3 indicators are doing this so I have to sell. I also find looking at price over several time periods invaluable.. Anyway, my question is do you think i'm wasting my time on 5min fx charts with no volume etc or should i continue until i can get a decent index trading platform? Is volume that important?

1. There is lot of noise on 5min Forex, better to trade off 10-15min.
2. As it is unregulated market, the only way to get some idea of volume is via tick vol which e-signal delivers.
3. E-signal provide charting, Tradeguider also links to e-signal and analysis the vol to detect professional footprints.
4. Anyway I have learnt that both price and vol are never going to be accurate, only banks have that info. so effectively you are trading against the crowd and your broker who quotes these.
check out this website: you might consider moving on to the regulated currency futures at CME:
http://www.tradingeducators.com/forum/showthread.php?t=28&page=3
 
jackjones said:
Hi, thanks for this great thread. I have been trading price on and off for some time now with a decent amount of success in forex 5min. I don't have the link but in one post someone mentioned just "watching price" for the day. I find this invaluable as you can start to understand what is effecting price and how it will react over time, not wow these 3 indicators are doing this so I have to sell. I also find looking at price over several time periods invaluable.. Anyway, my question is do you think i'm wasting my time on 5min fx charts with no volume etc or should i continue until i can get a decent index trading platform? Is volume that important?

The "someone" was probably me, though I suggest watching for far longer than a day. Several weeks would be more like it.

In any case, only you can decide whether or not you're wasting your time on 5m fx charts with no volume, etc, or whether or not you're wasting your time on 5m fx charts, for that matter, or even fx itself. If you can't come up with a consistently profitable strategy, then you're wasting your time, regardless of whether or not someone else can. Your best trading instrument may lie elsewhere.

Note, however, that I posted these charts without volume and I did so intentionally. Volume can be helpful, but it is not critical. It may not even be very important. The raison d'etre of this thread is S/R. Naturally, trading activity has something to do with where S and R lie. But can one detect and plot and exploit S/R without volume? Of course. These charts provide examples of how to do so.

As for "just watching price", the newcomer gets the most out of it by doing just that, watching price. He doesn't concern himself with what price is going to do next. He doesn't concern himself with where he might enter or what his stops might be or where his targets might lie. All of that comes later. Perhaps much later. At the beginning, his only task is to understand how price moves and to become sensitive to the changes in the balance between buying pressure and selling pressure and to those levels and zones where those changes take place. Once he understands that, volume becomes an elective, not a required, and he can then begin to investigate how he can make money off of all this.

I hope that readers will take the other sets of charts (in posts 3, 4, and 10) and try to "narrate" them without regard to prediction or cosmic meaning or particularly what they would DO with any of what they see. Once one learns how to observe price action objectively and disinterestedly, he will be much better able to plot S/R more accurately.

Db
 
dbphoenix said:
The "someone" was probably me, though I suggest watching for far longer than a day. Several weeks would be more like it.

In any case, only you can decide whether or not you're wasting your time on 5m fx charts with no volume, etc, or whether or not you're wasting your time on 5m fx charts, for that matter, or even fx itself. If you can't come up with a consistently profitable strategy, then you're wasting your time, regardless of whether or not someone else can. Your best trading instrument may lie elsewhere.

Note, however, that I posted these charts without volume and I did so intentionally. Volume can be helpful, but it is not critical. It may not even be very important. The raison d'etre of this thread is S/R. Naturally, trading activity has something to do with where S and R lie. But can one detect and plot and exploit S/R without volume? Of course. These charts provide examples of how to do so.

As for "just watching price", the newcomer gets the most out of it by doing just that, watching price. He doesn't concern himself with what price is going to do next. He doesn't concern himself with where he might enter or what his stops might be or where his targets might lie. All of that comes later. Perhaps much later. At the beginning, his only task is to understand how price moves and to become sensitive to the changes in the balance between buying pressure and selling pressure and to those levels and zones where those changes take place. Once he understands that, volume becomes an elective, not a required, and he can then begin to investigate how he can make money off of all this.

I hope that readers will take the other sets of charts (in posts 3, 4, and 10) and try to "narrate" them without regard to prediction or cosmic meaning or particularly what they would DO with any of what they see. Once one learns how to observe price action objectively and disinterestedly, he will be much better able to plot S/R more accurately.

Db

These two previous posts are IMO worth re posting especially for your summary DB

regards

rols

rols said:
The market is real so why not try to engage with it rather than struggle from a perspective of confusion and perplexity?

IMO until you can learn to 'let go' than no number of high probability signals would be of any use to you.

When the DAX opens next just passively observe the price action alone and nothing else. The aim is to become the market, to internalise and flow with the other thousands of traders doing the same as you. This may sound touch feely BS but just try it. After a while you'll see where all the S & R levels are and more importantly the character of this market will become something you know and with much practise will be to some extent become predictable. Then when that stage is reached it will be time to get the charts back up and depending on how your unique intuitive reading of the market has formed then you in turn will be able to develop your own strategies relevent to your interpretation.

I hope this is of some help...

dbphoenix said:
Jeez, rols, you're beginning to sound like me.

This search for instructions as to where EXACTLY to draw the line is in large part what makes Pivots and Fib and Gann and MAs and so forth so seductive. One doesn't have to think about just where it is that price(traders) really react. All the trader has to do is draw the calculated lines. This search for exactitude also motivates the search for the EXACT stop and exact TYPE of stop that the trader should use, along with the EXACT trigger and the EXACT target. But if it were all that simple, one could package it into a kit and sell it (wait a minute . . . ).

Many people can't get this. Maybe most people can't get it. They simply cannot trade without indicators, they can't trade without patterns, they can't trade without candlesticks, etc. And if they make money doing whatever they're doing, who's to say they're not right to do it. However, a lot of people also struggle with all of that and can't make money at it. They find instead that focusing on price is best for them. Unfortunately, by the time they reach that point, they have to unlearn an extraordinary amount of what for them is generally -- or entirely -- useless information (I've read that . . . People say that . . . I've been told that . . . ). This state of affairs makes learning to trade by price vastly more difficult than it would have been had the trader learned how to do it outright in the first place. But there's no going back, this side of amnesia, so wanting to is simply wishful thinking.

This isn't the first time I've heard all of this, of course. And the Go With the Force, Luke stuff only goes so far, true as it may be. But the individual who's willing to backtrack and learn a new or at least different way of looking at charts and price action may -- not will -- find that when he's looking at his umpteenth chart, the light suddenly goes on and he understands all those back and forth pressures which are propelling price one way or the other. All the babble about pace and momentum and trend and chop and all the rest of it will make sense.

But there's no shortcut. One may have to look at hundreds of charts. Maybe thousands. And he may never get it. Which is why people continue to spend so much money on 4x Made Easy and Weekend Seminar (lunch included) and Profits R Us.

Db
 
Yes, a copy of your post belongs here. I hope newcomers pay special attention to words like

After a while . . . will become . . . will be . . .

In other words, one doesn't stare at price action for an hour or so in the morning and be ready to trade in the afternoon. If the trader isn't "in the moment" and focusing entirely on what's in front of him, what's happening at that moment, then all this "observing" is probably a waste of time.

Db
 
Db,
Below are two excerpts from your "Bases" and "Rectangles" articles:

"Bases" excerpt
If, however, what looks like a base is actually a roller-coaster in a narrow horizontal band with loads of volume to the upside and loads of volume to the downside, no agreement has as yet taken place, and to invest in this stock at this time would be extremely dangerous as there is no clue as to how this battle will be resolved.

"Rectangles" excerpt
Rectangles are a particular kind of base. They move sideways like a flat base, but they sure ain't flat and they sure ain't quiet. And they illustrate the phenomena of support and resistance in a very simple and easy-to-interpret way, better than almost any other kind of base.

Questions:
1. What is the entity to which you are referring in the "Bases" excerpt?
2. Is (are) the characteristic(s) which differentiates this entity from a rectangle the volume, a lack of identifiable S/R areas within a narrow horizontal band, the position of the lateral price action in the overall chart price pattern, some of these, none of these?
3. Depending on the answer to 2. (excuse the dangling participle) is the entity the fabled "Not a base" aka a mess?

TIA
ljey
 
A base is defined by its purpose, i.e., the paragraphs preceding and following what you've quoted, as well as in the Supply/Demand chapter which you probably don't have. The illustration at the end of the chapter illustrates what you've quoted as well as anything would.

In addition, bases aren't generally tradeable, at least most people wouldn't choose to do so. The ERICY chart that wasp posted to his journal is an example of a base that I would choose not to trade since it appears to be accumulative. I'd rather wait until the egg is ready to hatch. Bases can also thrash around with little rhyme or reason. You can't trade a pattern you can't detect.

Rectangles, however, as noted in your quote, are not distinct from bases. They are a particular kind of base, as illustrated in what you have, and are not necessarily accumulative or distributive. Trend-traders will generally avoid bases, regardless of whether the base is a tradeable rectangle or not.

Db
 
Analysis of charts #4, part 1

As no one else has picked up the suggestion of analyzing, or narrating them the other charts, I've decided to give it a try regardless of the outcome or comments I may receive. I choose #4, because in #3 there were volume charts and as of yet I'm still looking at charts without the volume on it.

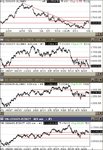
So at the left, the composite chart which includes NQ, ES, YM shows what happened the last couple of months on a chart where each bar is one day. The left upper chart shows the last two weeks and the first intraday chart ends with the opening of the current day (7/12) if I'm correct. Price has been travelling upwards for quite some time. During the last couple of months it has found support at 1650 on more than one occasion, which indicates this could send price moving downwards fast if it were broken. A breakthrough appears to happen around 5/12, price plummets all the way down to 1540. The following months (right uptil around 7/11) it's hovering between approximately 1525-1600. After the last swing up however (around 6/23), price has been in a continuining downwards trend without any attempts to throw this around, except for one faint attempt around 7/7 (upthrust?).
 

Attachments

  • FW4a.jpg
    FW4a.jpg
    104.8 KB · Views: 351
Analysis of charts #4, part 2

So, let's start by looking back at what happened at the previous day and where S/R can be found. 1534 appears to be a possible turning point. Price hesitated the previous day at 1356 but continued upwards without much agony. Reaching all the way to 1542 it then recoils over 4 points. A second attempt is made to go higher but fails just at 1542 and buyers seem to have lost control, as price tumbles down to what has been a previous R level 1534, making a higher low. So previous resistance turns out to be support according to what dbphoenix refered to as the "principle of reciprocity". Taking a look back at the big picture, we see that around 1540 price already established something solid during May and June. Around 15:20 price is able to pull yet higher and above the previous high, climbing up to 1548. Looking left again we find something of a congestion zone on the days 7/7-7/10 which could signal the temporary end of the upmove. Price tops 1548 and as buyers and sellers are trying to find and equilibrium they move around 1546-1548 for about an hour after which price turns back to 1542, bounces off but is unable to reach higher than 1545. That point also signals the end of the day, so we're closing near the high.

The next day price opens below S @ 1542 (and within the trading range of the previous day, being 1522-1548). It then tries to find some support at 1538. Reaching for a possible breakthrough, price is up above 1542 but only for a while as sellers are able to push price lower again. After that price rallies up and makes another high, but lower than the previous top. Buyers are acknowledging the fact that price won't go any further and basically, they turn away to see price following below the 1538 possible support. Near the end of the chart price is making a little zone below what now is resistance what could signal the continuation of the current move.
 

Attachments

  • FW4b.jpg
    FW4b.jpg
    43 KB · Views: 306
Last edited:
Top