S/R and the Mirror of Erised

firewalker99 said:
I see the difference between Szimba's and my analysis. It's cleary coming from a different "mind". But how does one learn to profit from situations, signals, moves, without thinking about what to do next? I'm not a scalper and I'm not trying to "act" all day long. So fine if I have to stick to looking at what's in front of me instead of thinking about what to do next, but I wonder at want point a trader acknowledges his/her signal if he keeps focusing on what's behind him instead of for instance anticipating what could be a retest of support at a later time without keeping that in the back of his mind.

We seem to be stuck in a loop here. You're not focusing on what's behind you; you're focusing on what's in front of you. If your strategy says buy when price breaks above R or short when price breaks below S, then you buy when price breaks above R or short when price breaks below S. If price doesn't break above R or below S, then you do nothing. If you're unable to do either, then you haven't tested your strategy thoroughly enough. If you haven't tested it thoroughly enough, or at all, then perhaps you haven't defined it well enough to test it.

If you've adequately defined what it is you're looking for and if you've tested it to the point where you know how likely one outcome will be over another and if you've thoroughly planned your trading day, the question of "what to do" does not come up.

Your puzzlement may arise from a desire to use something off the shelf rather than create something of your own. This is generally considered to be a short cut, but can be an expensive one if the trader doesn't bother to test the system. You have to test whatever you do before putting your capital at risk regardless of where the strategy comes from. Risking your capital isn't going to make the strategy work any better or any faster.

Db
 
dbphoenix said:
Given how comfortable you are with S/R by now (what's it been? two years?), and if you are reasonably confident with the retracement part of your strategy, I suggest you move on to the breakout and reversal parts. Since you now know the drill, they shouldn't take that long.

Db

My trading plan (trading retracements in stocks with runaway characteristics on the daily chart in the US) doesn't satisfy me, because I got very few setups. (There was only seven trades in the last three months)
This is clearly not enough to earn a living from it. And also not enough to draw conclusions about profitability. I'm in the red with it , but it's only seven trades.
Since I want to trade full-time in the future, I have to make changes in the trading plan. (I.e: Instrument and definitely shortening the trading period.
So now, beside continuing the trading of my plan with tiny amounts, I'm developing another plan on retracements and researching other markets.(back and forward testing)
 
Identifying significant points on a chart

Dbphoenix (and Szimba, and anybody else who's interested):

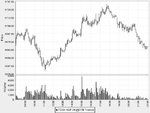
I've tried my best at previous day's chart (FDAX). Trying to focus on what's happening instead of what I should or should not do. It takes a different approach, but I hope this can be a step in the right direction. Red lines indicate S/R lines of previous days, left 5675 out of it as I don't see price reacting around that level... There are probably more significant points, but I tried to limit the exercise to those I found most interesting.

1) Af a small zone of horizontal accumulation between 0815 and 0845, price turns higher but is not able to break through resistance. This further strengthens the 5695 level which we've seen on previous days.

2) Price is back where we started the day, at 5670, buyers are coming in and push price higher again up to 3.

3) Buyers are done, and from this point on sellers take over. They push price all way down to 4.

4) Little hammer which reaches above 5650, previous support.

5) Sellers appear done for now, after two wide spread down bars closing near the high which could indicate a reversal because this happens on support.

6) Back to the 5650 level where price fizzles around, closing above and below the line. Buyers and sellers are trying to figure it out.

7) At this point 5 appeared to be a selling climax. Buyers are able to push price much higher in a short time frame.

8) From 7 to 8 a little retracement, before the upmove continues.

9) Similar bar to 7, buyers are still very strong and price closes on the high.

10) Back to what appeared to be a reversal point earlier and again price turns away instantly but fails to go very far away this time...

11) Would you call this an airpocket?

12) Noise from opening of American stock exchanges and a swing low but still above the support at 5695.

13) The first time prices fails to make a higher high after the uptrend, and incidently this happens on a hammer.

14) None of the upbars are able to put on a spurt to push price much higher.

15) Buyers are still in the game, but none of the upbars close on the high. Traders aren't interested in buying at this level.

16) Last of the buyers attempt to keep price above support, but fail to do so as shown by the very small spread upbars.

17) Price spikes up from the 5695 level after which buyers and sellers are in search for an agreement...

18) From this point on price finds no support and keeps declining.
 

Attachments

  • 20060809-b.GIF
    20060809-b.GIF
    41.8 KB · Views: 446
firewalker99 said:
Dbphoenix (and Szimba, and anybody else who's interested):

I've tried my best at previous day's chart (FDAX). Trying to focus on what's happening instead of what I should or should not do. It takes a different approach, but I hope this can be a step in the right direction.

Much improved, but I'll leave it to others to make specific comments.

Db
 
Nice job Firewalker!

Who am I to give you advises? I'm just a same novice as you, but since you mentioned my name here are my thoughts:

I just added a couple of S/R line which I would have drawn, probably you already seen them.

You can get more evidence (or not) of selling exhaustion at 5, if you can see volume.
Later you call 5 as selling climax. Although this is the bottom for the day, in my terms this is not a climax. I require the last bar to be the longest during a downtrend to call it climax. But it is not as important how you call it, until you translate trader behaviour well.
What is important, to have constant definitions for your own use. (Also for accumulation. I wouldn't call it as accumulation, but maybe your definitions are the same as mine.)
Volume also could be a help after 14.

What I like most in your work, that you started to think about what buyers and sellers are doing and what is the result of their transactions.

Regards
Szimba
 

Attachments

  • firewalker.jpg
    firewalker.jpg
    149.6 KB · Views: 369
Szimba said:
You can get more evidence (or not) of selling exhaustion at 5, if you can see volume.

You say you're a novice, but you sure have a bitter handle of this price action stuff than me. So perhaps you're not so novice after all :) Anyway, I added a chart with volume, as you can see there was quite some around what I called a potential SC. At point 14 again there was high volume.
What bothers me though is the extremely high volume around 1500, shouldn't one assume this is a serious sign of weakness because a lot of people where selling within that bar? In what way do you include volume in your analysis?

For the moment, I'm still leaving volume out of my charts because I don't feel I have a complete understanding of price movements.
 

Attachments

  • 20060809.jpg
    20060809.jpg
    40.5 KB · Views: 318
dbphoenix said:
Much improved, but I'll leave it to others to make specific comments.

Db

I've noticed in earlier posts and charts you're using a lot more references to volume than in more recent comments. Why the change or is there a specific reason for? Take for example #56 from your PV thread, I know it goes way back about 2 years but I was interested in knowing your motives for changing -or refining- your approach.
 
firewalker99 said:
I've noticed in earlier posts and charts you're using a lot more references to volume than in more recent comments. Why the change or is there a specific reason for? Take for example #56 from your PV thread, I know it goes way back about 2 years but I was interested in knowing your motives for changing -or refining- your approach.

You'll notice in post #5 of the PV thread that I point out that volume is just trading activity. I've always looked at volume that way. However, beginners -- and many not-so-beginners -- insist on looking at volume as some sort of indicator and focusing on the individual bar as being weighted with meaning. How much of this has to do with candlestick theory and VSA, I have no idea. But I eventually had to stop including volume on my charts entirely because they couldn't see price action through their volume-filtered glasses, so much so that they found trading without volume virtually impossible. Many if not most beginners -- and not-so-beginners -- also have an unhealthy dependence on the "bar", and the length of the bar, and the shape of the bar, and counting bars, which is one reason why people who don't have so much to unlearn seem to have an easier time of it.

Db
 
firewalker99 said:
What bothers me though is the extremely high volume around 1500, shouldn't one assume this is a serious sign of weakness because a lot of people where selling within that bar?

I know you're asking Szimba, but there's no reason why one should consider this a "serious sign of weakness". A lot of people are selling, but a lot of people are also buying, which is why the "volume bar", i.e., the trading activity, is so high. All that matters is who is exerting the greater pressure. And you know that by what's happening to price. Price is rising. Therefore . . .
 
Szimba said:
You can get more evidence (or not) of selling exhaustion at 5, if you can see volume.
Later you call 5 as selling climax. Although this is the bottom for the day, in my terms this is not a climax. I require the last bar to be the longest during a downtrend to call it climax.

Incidentally, Szimba, what is one way you could determine whether or not this is an SC, in real time, without volume?

Db
 
dbphoenix said:
You'll notice in post #5 of the PV thread that I point out that volume is just trading activity. I've always looked at volume that way. However, beginners -- and many not-so-beginners -- insist on looking at volume as some sort of indicator and focusing on the individual bar as being weighted with meaning. How much of this has to do with candlestick theory and VSA, I have no idea. But I eventually had to stop including volume on my charts entirely because they couldn't see price action through their volume-filtered glasses, so much so that they found trading without volume virtually impossible.

You say volume in itself has no meaning and have to look at what happens to price. Ok, but in your earlier posts (ET forum, NQ charts) and PDF files, I've noticed you did mark individual bars with arrows indicating the volume on that bar. VSA tells the same story, and yes that's why I'm having so much learning it the other way, because I need to abandon all that other stuff first. I'm not attacking you in any way about what you did in the past, I was just noticing a change in the way you comment charts.

dbphoenix said:
Many if not most beginners -- and not-so-beginners -- also have an unhealthy dependence on the "bar", and the length of the bar, and the shape of the bar, and counting bars, which is one reason why people who don't have so much to unlearn seem to have an easier time of it.

Right again, but if for instance defines "retracement" as a small price movement back in the direction counter to the trend you would ask: define "small". I would answer that the spread of the bars isn't that wide. I don't want to go into details about my own trading plan in this thread, but if the shape, length and number of bars don't matter at all then you could just draw a line on your chart instead of bars or candlesticks? Doesn't a WRB on high volume with price rising have meaning just as a couple of up and downbars where price goes nowhere mean something else?
 
dbphoenix said:
Incidentally, Szimba, what is one way you could determine whether or not this is an SC, in real time, without volume?

Db

Now this is one question I'd really like to hear the answer to :cheesy:
 
dbphoenix said:
Incidentally, Szimba, what is one way you could determine whether or not this is an SC, in real time, without volume?

Db

Without volume, I would just guess.
I call selling climax when in a long downtrend fear hits new high among traders and all those who feared are rushing to sell. This has to effects. The first is that the sellers are not waiting for better bids, but hit the actually best bid to unload whatever they want, so the fall of the price is accelerating, creating the longest bar in the trend. The second is that in a selling climax everybody involved who previously just monitored price action and therefore activity (volume) will be the highest.
(Selling climax is also the first point where one can buy if he has a trading plan for it. The really big institutions have to buy here, because they can not buy size easier later in tha base or in the uptrend.)

Szimba
 
firewalker99 said:
You say volume in itself has no meaning and have to look at what happens to price. Ok, but in your earlier posts (ET forum, NQ charts) and PDF files, I've noticed you did mark individual bars with arrows indicating the volume on that bar.

Yes, and I've also said, repeatedly, that the trading day consists of series of buying and selling waves propelling price up and down. The bar chart is one means of illustrating those waves and that movement. Any given bar may have a number of waves contained within it. If the beginner chooses to ignore all of that and focus on the bar without regard to anything that's come before or that will come after and without regard to all the trading activity that's taken place within that time interval to create that bar, there's nothing I can do about that other than provide a lengthy disclaimer at the bottom of every chart. I've found it easier to simply eliminate volume entirely.

if the shape, length and number of bars don't matter at all then you could just draw a line on your chart instead of bars or candlesticks?

Many people do. Try it.

Doesn't a WRB on high volume with price rising have meaning just as a couple of up and downbars where price goes nowhere mean something else?

It means that buying pressure is greater than selling pressure. A couple of up and down bars that go nowhere mean that buying pressure and selling pressure are equalized. The market couldn't care less how you choose to display that.

We seem to be departing from S/R here. If you have any other questions specifically regarding PV, I'd prefer that you ask them in the PV thread

Db
 
firewalker99 said:
Anyway, I added a chart with volume, as you can see there was quite some around what I called a potential SC. At point 14 again there was high volume.
What bothers me though is the extremely high volume around 1500, shouldn't one assume this is a serious sign of weakness because a lot of people where selling within that bar? In what way do you include volume in your analysis?


In the light of volume I still wouldn't call 5 as SC, because the trading activity is the same as four bar earlier and the bar's range also not unusually high. But that is me.

Your second question was answered by Dbphoenix. Effort-effect.

Szimba
 
Szimba said:
Without volume, I would just guess.
I call selling climax when in a long downtrend fear hits new high among traders and all those who feared are rushing to sell. This has to effects. The first is that the sellers are not waiting for better bids, but hit the actually best bid to unload whatever they want, so the fall of the price is accelerating, creating the longest bar in the trend. The second is that in a selling climax everybody involved who previously just monitored price action and therefore activity (volume) will be the highest.
(Selling climax is also the first point where one can buy if he has a trading plan for it. The really big institutions have to buy here, because they can not buy size easier later in tha base or in the uptrend.)

Szimba

That definition is fine is it's worked for you and continues to work for you, but consider more deeply what you're saying about trader behavior, and be careful not to confuse "SC" with "hammer". You are correct with regard to everything you've said about seller psych and the SC. But consider that the SC often takes place before the lowest low. In this case, there was a lot of unloading in the bar that is four bars before the lowest low bar (and for everybody else, I'm using "bar" because that's the way this activity is illustrated here; if it were a dot chart, I'd refer to the particular dot or dot cluster). Therefore, even though the lowest low bar is not the longest, price does close well off the low, and you could hypothesize an exhaustion.

Buying here, though, would be extremely aggressive since it would be after all a counter-trend entry. However, if you'll remember what I've said about supply lines and Sperandeo, there is a relatively safe entry with a tight stop which you could make even if you didn't incorporate "volume" (see below).
 

Attachments

  • Image2.jpg
    Image2.jpg
    48.6 KB · Views: 434
Thank you for the corrections and insights!
As for the buying points, Mamis (and probably others before him) says the first point to buy is the SC, the second is the retest of the low, the third is the BO and fourth is the retracement.
I plan to go backward in this list when developing my trading plans.

Szimba
 
Szimba said:
Thank you for the corrections and insights!
As for the buying points, Mamis (and probably others before him) says the first point to buy is the SC, the second is the retest of the low, the third is the BO and fourth is the retracement.
I plan to go backward in this list when developing my trading plans.

Szimba

Remember, though, that Mamis has three categories of risk. It's up to you to balance them all.

Db
 
dbphoenix said:
Buying here, though, would be extremely aggressive since it would be after all a counter-trend entry. However, if you'll remember what I've said about supply lines and Sperandeo, there is a relatively safe entry with a tight stop which you could make even if you didn't incorporate "volume" (see below).

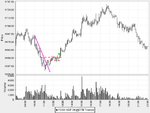
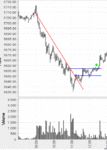
Looking at the chart, it looked like a familiar pattern and I scrolled back in my charts of the last couple of days&weeks and found what looks - to me - a very similar (potential) selling climax. To mark the similarities I draw a trendline and marked a possible entry point. The first part of the chart shows just up until that point. I don't want to trick anybody, so I attached the complete chart of the day also. You can see what happened... Next at 1330 there's what I thought the real SC, but at 1445 volume peaks once more. In both cases the downfall accelerated and especially at 1320 I see a long downbar.

I don't think there really is a way to tell whether or not it's a SC. But perhaps you don't need to, if that's not what you're going to trade. But if it is, and as you suggested there is a relatively safe entry point, than I'd like to know your or Szimba's views on this chart as both of you seem to have a handle on this.
 

Attachments

  • sc.GIF
    sc.GIF
    23.2 KB · Views: 335
  • SC1.GIF
    SC1.GIF
    52.1 KB · Views: 378
firewalker99 said:
Looking at the chart, it looked like a familiar pattern and I scrolled back in my charts of the last couple of days&weeks and found what looks - to me - a very similar (potential) selling climax. To mark the similarities I draw a trendline and marked a possible entry point. The first part of the chart shows just up until that point. I don't want to trick anybody, so I attached the complete chart of the day also. You can see what happened... Next at 1330 there's what I thought the real SC, but at 1445 volume peaks once more. In both cases the downfall accelerated and especially at 1320 I see a long downbar.

I don't think there really is a way to tell whether or not it's a SC. But perhaps you don't need to, if that's not what you're going to trade. But if it is, and as you suggested there is a relatively safe entry point, than I'd like to know your or Szimba's views on this chart as both of you seem to have a handle on this.

And that's the difference between trading in real time and "trading" in hindsight.

I'll address this since it's been posted, but if there are any more posts which have to do with PV, please post them on the PV thread, as I requested earlier.

Since the typical recoil appears to be 15, I'd be out if price recoiled to that extent, which would put me out at BE, and prepare to re-enter if price found S at that level. If it didn't, and since I know nothing about this instrument, I'd slalom it if for some reason I had no choice but to trade it, shorting the drop below S, SAR at the HrL @1345, SAR again at the LrH @1400, SAR again at the HrL at 1530, then trail the stop below the SPs, MOC, none of which would require any plotting of volume or S/R or calling climaxes or bottoms or tops.

On the other hand, if I didn't have to trade it, I'd study it, at least two or three hundred charts of it in order to cover the entire market cycle, get to know it, the people who trade it, its average daily range, its MAE and MFE, where S/R lie, what stops work best and so on.

Again, if there are further questions in this vein, please post them to the PV thread.

Db
 
Top