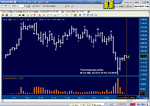
S&P analysis for Friday 2nd Oct

Hi Dandxg;

Your question;
My question is can you compare volume of regular trading hours normal trading to say RTH volume when it's the NY lunch hour or should this be viewed in their own. Typically NY lunch hour volume drops off. This is one of the areas I am really not clear on at this moment.

The principles are the same in any time frame in any part of the session, you will still get Volume and price signals throughout the session, I think you'll find that the smart money are usually active at the begining of the session and at the end of the session. except around FOMC etc. You should not assume that in the lunch hour, things would be any diffrent.

Regards Sebastian
 
ES analysis for Friday 9th Nov 07

Enjoy
 

Attachments

  • ES Analysis for 9th Nov 07.pdf
    58 KB · Views: 1,477
Thanks Sebastian for your help. I have a question for you. If you get a retest of high or low on lesser volume I know this is normally a good place to sell/buy. My question is can you compare volume of regular trading hours normal trading to say RTH volume when it's the NY lunch hour or should this be viewed in their own. Typically NY lunch hour volume drops off. This is one of the areas I am really not clear on at this moment. db phoenix could you give your pro opinion as well. I consider you 2 some of the best their is at PV - VSA trading. Best of trading to everyone. :cool:

I apologize for not posting a chart. I need to learn how to mark up chart on Sierra and then figure out how to post on T2Win.

Depends on what you mean by "compare" and what you're comparing and why. If you're comparing volumes in the context of test-retest, remember that the point of a retest is to determine whether or not selling (or buying) has dried up. The most accurate comparisons will be found within the same timeframe, e.g., opening to lunch. A retest on light volume during lunch may mean only that nobody's home.

Your best conclusions, however, will be drawn from charts. Even a "rule of thumb" in this regard can be misleading.

Db
 
Many thanks to both of you for your expert commentary.

Tom's book is now available as a free download (e-book), the Bootcamp CD is visual so it certainly enhances your learning curve. Then you only require a charting package which prints Price bars and Vol.

You can learn a lot from threads by Dbphoenix on price/vol and analysis on this thread, plus there is some info on TradersLaboratory which may help:

http://www.traderslaboratory.com/forums/f34/vsa-volume-spread-analysis-1369.html
 
Thanks Joey, I have been doing all the above as you suggested already. It's like anything it will take time and practice. I bought the swing low on the ER2, just practicing on sim, about an hour ago with selling volume almost completely dried up and got 10 tick in 2 minutes, trade worked for 40 ticks, 4 points max.

I was re-reading Williams' book and Wyckoffs' Day Traders bible and I believe I picked up that you should ultimately stay in a winning trade until you get a reversal signal. If long a huge up thrust close on low with high volume, does that sound right folks? Obviously you can tell someone how they should trade but that is the ultimate goal stay in a trade until you get a strong reversal signal?

It's awesome this method of trading, really chart reading I guess, works in any liquid market. I saw a beautiful sell signal in both 6C and 6E today, probably the same in the 6B as well.

If you get hold of Vadym Graifer's book on "Techniques of Tape Reading" (nothing to do with DOM orders or Time/Sales) you will find material to work out strategies and tactics for entry/exits etc.

There is no one single method of entry or exit for a particular setup.
You can exit for a fixed no. of points for each trade, or identify a support/resistance level as a target, or put on a moving average/trendline, etc. Tom williams employed a simple concept: stay in the trade as long as the close is above the previous close ie. if you are long, one bar retracement is allowed, if more than that, get out. Ofcourse all this depends on the timeframe you trading. with 2/3min charts it is obviously going to get choppy,
 
ES Monday 12th Nov

Hi All, thanks for looking
 

Attachments

  • ES Analysis for 12th Nov 07.pdf
    63.4 KB · Views: 1,261
ES Analysis for Tuesday 13th Nov 07

Regards Sebastian
 

Attachments

  • ES Analysis for 13th Nov 07.pdf
    67.9 KB · Views: 1,152
Just out of curiousity, does anyone use P and F in addition to bar, price and volume as Wyckoff suggested for price targeting. I was just reading a interesting article from Hank Pruden dot com on the Dow reaching 14,400.

Thanks Sebastian for the continued daily reviews they help my learning curve.
 
Today I thought that you could give your analysis for today

I have decided to give you the challenge of interpreting the day's action, I feel that there is enough information in my past posts, for anyone to give a reasonably good analysis of the day's action, it would be better if you started doing this yourself, better for your experience.

good luck.
 

Attachments

  • ES Wednesday 14th Nov.gif
    ES Wednesday 14th Nov.gif
    41.7 KB · Views: 505
I have decided to give you the challenge of interpreting the day's action, I feel that there is enough information in my past posts, for anyone to give a reasonably good analysis of the day's action, it would be better if you started doing this yourself, better for your experience.

good luck.

Well I know A and E are upthrust/downthrust on high volume. Other than that I would need to analyze a bit better, but I have been studying for already 10 hours so my brain is a bit mush, sorry. :cheesy:
 
I have decided to give you the challenge of interpreting the day's action, I feel that there is enough information in my past posts, for anyone to give a reasonably good analysis of the day's action, it would be better if you started doing this yourself, better for your experience.

good luck.

I'll give it a try,hopefully i can get a couple of bars correct :eek:

A- wide spread up bar with highish vol closing off top. selling in the bar. sign of weakness.pros selling into the up move. next bar is a nice upthrust
B-looks like a test for supply closing on the high on high volume. sellers present,next bar confirms this closing on the lows. you would'nt want to buy this market at the moment.
C-price moves down, more buyers come in now tho
D- up bar closing near highs on lower vol, pros not interested in higher prices at the moment. next bar is pushed down
E- push down on increased vol closing near the highs. prices where marked down and then price reversed
F- no demand on lighter vol
G-successful test of supply on low vol, higher prices likely to follow
H-test for supply, low vol
I- back into res area, this bar and previous bar on increased vol, bars closing near middle, selling coming back in.
J- not sure about this bar, little vol, market unsure
K-no demand bar
L- Level still showing some support , but there is weakness in the background to be aware of
M-no demand
N-no demand. next bar wide spread down,through support on high volume closing on lows.


phew
 
Well done millsy500, you did very well, but B was a top reversal, and a major sign of weakness.

Regards Sebastian
 
ES Anaysis for Thrusday 15th nov

good trading
 

Attachments

  • ES Analysis for 15th Nov 07.pdf
    64.1 KB · Views: 1,112
No more charts until Monday.

Happy holidays.

I understand there are problems with this PDF, so I copied it out again for those having problems.

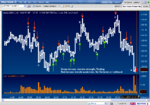
Intraday chart 21st Nov 07:

A; The market rallys, but is cut back with supply, else the close would be near the top.

B; Again, prices try to rally, but supply knocking prices back down.

C, Market is re-accumulated between 1426 and 1422, next red arrow denotes no upside interest at these levels, further accumulation between 1422 and 1418, next green arrow show little supply to the downside, always on down bars, then we see a red bar indicating the market is running out of steam.

D; As the market falls to this level, the volume is very low on these down bars, showing strength.

E; Market is redistributed between 1432 and 1438, note the volume is higher on these up bars.

F; Market trends down to this point, but there is no shaking out of the market, so prices rally to the old top at point E. Second green arrow is a nice test, low volume down bar indicating strength.

G; Prices approach an old top before coming off for the last part of the session. The market then collapses with 2 red arrows indicating no upside interest in prices before falling down to point H.

H; Market is re accumulating between 1424 and 1428, 100k contracts, as this is a holiday, I won't bother forecasting the next day's direction.

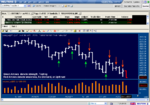
Daily chart:
This is a daily chart, the first red arrow shows no demand, the second shows a top reversal, the third red arrow shows more no demand, the forth is a weak bar because the high is greater than the high of the previous bar
the last red arrow is weak, because the volume is 3m contracts on an up bar, allowing today to be down.

The first green arrow shows demand swamping supply, the second green arrow shows no selling pressure, the third also shows little supply, although followed by no demand on the next bar which is weakness. The forth green arrow is a bottom reversal which shows strength.

All the indicators that I talk about are listed in Tom Willaim's book, The Undeclared Secrets.

Happy Holidays
Sebastian
 

Attachments

  • 21st Nov 07.png
    21st Nov 07.png
    72 KB · Views: 395
  • 21st Nov 07 daily.png
    21st Nov 07 daily.png
    45 KB · Views: 377
Top