S&P 500 & other indexes - intraday. Plus chat

It's dead as a dodo - 9 points sluggy range - I'm taking my ball and going home @ 11:45 if we don't get some action.

LOL - typed the above but didn't post it -

11:29 took a short...

7-5-201211-41-19AM.png


Got T1 & T2 by the time I posted this so just 1 remaining now & it's going to bloody well get hit or I am not playing tomorrow....

Sludgy, horrible market...
 
Pete - what settings do you have for your iceberg alerts?

less than 500 due to the holiday volume i presume?

It's dead as a dodo - 9 points sluggy range - I'm taking my ball and going home @ 11:45 if we don't get some action.

LOL - typed the above but didn't post it -

11:29 took a short...

7-5-201211-41-19AM.png


Got T1 & T2 by the time I posted this so just 1 remaining now & it's going to bloody well get hit or I am not playing tomorrow....

Sludgy, horrible market...
 
G'day

12:20am AUD AIG Construction Index 34.8 34.7
6:00am JPY Leading Indicators 95.9% 95.3% 95.6%
7:45am EUR French Gov Budget Balance -69.6B -59.9B
7:45am EUR French Trade Balance -5.3B -5.4B -5.8B
8:00am CHF Foreign Currency Reserves 364.9B 305.9B
8:15am CHF CPI m/m -0.3% -0.3% 0.0%
9:30am GBP PPI Input m/m -2.2% -2.1% -2.6%
9:30am GBP PPI Output m/m -0.4% -0.2% -0.2%
11:00am EUR German Industrial Production m/m 1.6% 0.2% -2.1%
1:30pm CAD Building Permits m/m 0.7% -5.2%
1:30pm CAD Employment Change 5.1K 7.7K
1:30pm CAD Unemployment Rate 7.3% 7.3%
1:30pm USD Non-Farm Employment Change 97K 69K
1:30pm USD Unemployment Rate 8.2% 8.2%
1:30pm USD Average Hourly Earnings m/m 0.2% 0.1%

3:00pm CAD Ivey PMI 55.4 60.5
3:30pm USD Natural Gas Storage 44B 57B
 
Last edited:
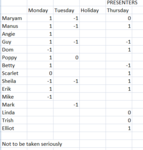
Here are the current standings of The Presenter's Index

Erik on +2 is currently leading this week !
 

Attachments

  • Presenters Index.PNG
    Presenters Index.PNG
    17.2 KB · Views: 175
Last edited:
The Presenters Index for Friday

Maryam - red - down
Manus - blue - up
Guy - red - down
Linda - red - down
Dom - green - up
Betty - red - down
Mike - red - down
Linda - red - down
Sheila - blue - up
Scarlet - black - neutral
Erik - pink - down
Elliot - blue - up


Just a bit of fun to see if the presenters dress subconsciously to forecast the day's close. The blue end of the spectrum for up +1 and the red end for down -1. Black, white, grey, purple are neutral and score 0
 
Last edited:
Mario Monti etc. have sat up all night

and aaaaaaaaaaaaaaaaaaaaaaaaaah

Come up with the wrong solution to Italy's problems !!!!!!!!!!!!!!!!!!!

Same old cr*ap about cutting jobs etc.

Are they so stupid or what ?

Why are the Italian taxpayers paying out so much for solutions that are NOT workable or possible.


Mario Monti, ecc si sono seduti svegli tutta la notte

e aaaaaaaaaaaaaaaaaaaaaaaaaah

Vieni con la soluzione sbagliata ai problemi d'Italia!!!!!!!

Stessa vecchia cr * ap di tagliare posti di lavoro, ecc

Sono così stupidi o cosa?

Perché i contribuenti italiani pagando tanto per soluzioni che non siano praticabili o possibile.
 
Pat - when the only tool you have is a hammer.....

July 6th

Not sure if I'll be trading today or not. Too quiet. Anyway - here is what I think:

7-6-20125-54-08AM.png


We have an obvious area of balance right now. We are at the top of a longer term balance area and in the grand scheme of things, there's not a lot of interest up here.

Trouble is - How would this 'lack of interest' be playing out if it wasn't a holiday week? It's a conundrum.

Anyway - you see the area - until volume steps in taking it out of this range (down would be my guess), we'll play ping pong around the 1355.50 - 1369 areas. That doesn't mate these numbers support & resistance, rather we expect failures above & below.

If it goes outside value & reverses overnight, I have to be biased towards the opposite of the range intra-day.

White, dashed horizontal lines are simply LVN areas -places where price got rejected previously.
 
Mario Monti etc. have sat up all night

and aaaaaaaaaaaaaaaaaaaaaaaaaah

Come up with the wrong solution to Italy's problems !!!!!!!!!!!!!!!!!!!

Same old cr*ap about cutting jobs etc.

Are they so stupid or what ?

Why are the Italian taxpayers paying out so much for solutions that are NOT workable or possible.


Let's hope for Britain's sake that clown Cameron is taking note
 
In your chart DT

what is the white dashes vertical line showing ?
And Is the green bit on the left volume ?

Trying to make sense of your chart and what it is telling us

( I'll put the hammer back in the toolbox )
 
The weakest quarter since October

The markets dropped

Did you catch that fundamental ?
Should have
 

Attachments

  • S&P 500.PNG
    S&P 500.PNG
    126 KB · Views: 170
Back
Top