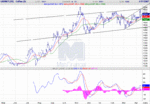
Hi Two daily candlestick hammers have formed on the arabica chart, temporaryusually point to a temporary or more permanent bottom .
Arabica has been one way down since testing the resistance at 130 and failing.
The second hammer is also an inside day with a higher close and finally the turn comes at support established in 1996 the last time we were this low.
Despite this further proof required to call end to this bear Arab 88.5 is alltime low over 30 years.
My favoured trade is to trade Robusta long which has been far more bouyant during this decline, it will be boosted further if Arabica ceases falling and even further if it climbs a bit.
I maintain that the premium will continue to close with Rob catching Arabica up, which it has tended to do in every Long run Robusta uptrend historically.
Chart below of weekly Arabica and Monthly detailing previous lows and the two hammers. With Relative Value to Gold in Purple at near all time lows over 40 years.
I am not yet convinced this is the begining of the mother of all runs as I still anticipate a Robusta Downleg before the set up is complete.
Also Chart showing relative outperformance of Rob in bull runs.
Enjoy along with The Cape Town sunset..
http://www.trade2win.com/boards/images/icons/icon11.gif
Red face
PS it seems I have chart problems apologise I will endeavour to try upload them subsequently.

