Really poor run in trading.

I'm mainly limiting myself to gbp/usd, eur/usd and occasionally usd/jpy (but I haven't traded it for a while as i'm ok with the opportunities on the first two.) I found if I tried to trade a lot of pairs i'd spend my time looking at a lot of charts and missing things so it's better for me and my style to spend more time on a few.
 
Makes sense. I tend to fly through charts looking for area's of interest and then those that have them I put together in a portfolio to watch more closely.

Do you not find the that by having both those pairs linked to the USD they behave similarly?

Also, do they give you enough opportunity to make a full time living from them?
 
Well, if you're using indicators and so on and just using those it may be ok for you to scan through the charts quickly - I on the other hand don't and look for any moves that are starting or recurring s/r points.

They do behave similarly quite often, but sometimes there are issues which may affect one pair more than others. For example UK CPI/RPI may affect gbp/usd a lot, but not eur/usd much. I did decide to trade chf/jpy so I wouldn't have to worry about the $ - but quite frankly I don't mind trading the $ these days.

I'll have to answer your question properly in a few months, but i'll have to say yes from what i've seen so far. I only need a small number of pips to net a good result, so even if I take one good trade that day it'll be enough.
 
I have my s/r, fibs etc drawn across say 30 charts. I open them up and look at the price action. If they are close to, or coming off area's of interest i'll save them for later. If they aren't i'll close them for the day. That cuts me down from 30 to say 5-6 in the first 30 mins of the day. From there i'll just watch and wait.

Pins bars don't seem to be doing me any justice at all these days though. I hope TD has more joy than me!
 
Pins bars don't seem to be doing me any justice at all these days though. I hope TD has more joy than me!

Pin bars are good and you can make money from them but they are not the be and end all of a trading strategy.

As I have said in my thread, the strategy I taught is about identifying high probability turning points and then interpreting what the market participants are doing at them by watching the price.

Pin bars are just one way of doing this.

I rarely trade them myself. More often than not I trade inside bars when I feel that major s/r levels are either going to hold or are being eroded and price is going to break out and sometimes I trade based literally on the price and how it behaves based on watching the ladder and not the chart.

Just work mostly on identifying the pivot points and then as price gets closer to them, really study the price action intensely. Does it accelerate or slow down? Does it false break the level and then rapidly reverse? What does this mean for traders that bought/sold the level? Does it consolidate and wind up tighter? Does this give you a better opportunity to get in with a tighter stop?

The market always gives clues.

Watch, recognise, and REMEMBER.
 
Last edited:
I read your thread and get what you are saying. I just find it easier to empathise with the market and understand why things happened, rather than try to trade them real time.

I took a trade earlier on the EUR/GBP. It looked a high probability trade, coming off resistence aggressively. I take the trade, and the market reverses!!!

Drives me mad some days!!

Not sure I like Inside Bars much either. Everytime I think they'll break high they'll break low and visa versa. Then i'll play a double trigger to catch a move either way and i'll have both positions caught on a swing!
 
Can you give me your thoughts in EUR/GBP? I've love to see if what you see is what i'm seeing!
 
I am short, hopefully not about to get stopped out. It is getting close. I went short when it retraced off the 38.2% Fib, thought that looked a good entry, but it is coming all the way back.

Am I playing it too tight?
 
It depends on your time frame really. I'm looking at some points which will act as resistance, but going on what i've seen today i'd probably fancy a long on it for about 80+ pips. But on my style alone, if I was personally doing it i'd be shorting off the points.
 
I guess that is the beauty of trading everyone see's different things. I see it as a short, clearly others see it as a long as it is going up!!!

What makes you think it will go up?
 
It's not a pair I trade as it's too slow for me. But the fact there are some support points which haven't really acted as resistance on the way up and it hasn't moved sharply away; which means in my opinion they have a greater chance of being broken. Also, I believe eur is stronger than the £ going on the data this morning and I reckon eur/usd has a better chance of moving up today than gbp/usd does.
 
Thanks. IT would be useful if we could add charts and annotate them on here so we can all see what we are talking about.

EUR/USD is green for the day, Cable Red, so I guess you are right based on individual strengths.
 
You can add a chart, but it's not necessary. If you go to the daily chart you can see all the support points and i'm saying they're not going to play today as it's not moving down quick enough so it's time to go long + the fundamentals too. Either way, you'll find out in a few hours which was the right decision.
 
Hi Stuart,
You're recent run is not surprising as you're trading forex and the volatility and choppiness there has been so evident lately. I'm sure this has caused many to reassess trading plans, stops and risk management. Interesting times, in the Chinese sense of the word.
NT
 
My stops will all depend on the pairs, and the distance to the nearest support.

I've not moved the stop on a single one of the losers, but the 2 break evens were clearly trades I moved the stops on.

I'm trying to post a pic but failing.

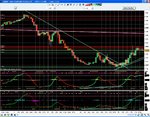
Anyway, i've just taken my next trade. Short EUR/GBP at 7828 taking the low of the previous 1 hr pin. Stop is at 7852 which is the high of the pin. That pin bounced off the 38.2% Fib retracement and the 85ma. Lets see where it goes!!!

Hi Stuart14

Sorry to hear of your trading difficulties.

I have the EUR/GBP cross on my watchlist but not trading it at the moment because the instrument isn't trending.

I think the following observations may help you.

1. Your Pin is the price action in the aftermath of UK Inflation Figures which were announced at 9.30am.
2. The preceding candle was a bull candle with a very long tail.
3. Price Action in the last 18 hours could not be construed as overly bearish.
4. Bullish Momentum Divergence observed (see 3. above)
5. Extensive Support at Round Number 7800 and slightly below when looking at the Daily Chart.
6. Reward/Risk Ratio just over 1x.

HTH

F
 

Attachments

  • EURGBP 120808 1hr.JPG
    EURGBP 120808 1hr.JPG
    263.3 KB · Views: 171
Hi Stuart14

Sorry to hear of your trading difficulties.

I have the EUR/GBP cross on my watchlist but not trading it at the moment because the instrument isn't trending.

I think the following observations may help you.

1. Your Pin is the price action in the aftermath of UK Inflation Figures which were announced at 9.30am.
2. The preceding candle was a bull candle with a very long tail.
3. Price Action in the last 18 hours could not be construed as overly bearish.
4. Bullish Momentum Divergence observed (see 3. above)
5. Extensive Support at Round Number 7800 and slightly below when looking at the Daily Chart.
6. Reward/Risk Ratio just over 1x.

HTH

F

Thanks a lot. That is a really useful post and of course 100% correct. I think I am getting better with trends, fibs, s/r etc but still miss what is retrospectively obviously bad set-ups like this one

Stopped out now.twice in 1 day on the same pair!

Onwards till tomorrow!!
 
How long have you been trading? Don't try and find opportunities, let them find you.
 
Top