Proverbs 16:3 Trading Strategy

Long USDJPY

USDJPYH1-Long.pngUSDJPYH1StoppedOut.png

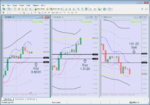
The fast and intermediate envelopes seem to be offering support at this level. The longer-term envelope is arguably neutral, and this is all perhaps reason enough to enter a long position.

Looking back over the past few days, there seems to be a lot of "noise" right around the 102.05 handle, so that's where I felt comfortable placing my take profit target.

RESULT: Though it might have been "arguable" that the longer-term envelope was neutral, undeniable it clearly was not. Though I was stopped out (see second chart above) I will still be interested to see if price continues south, or if the pair just made a "last hurrah" of sorts, especially since price was rejected when it tried to fall below this level (101.80) on the 15th and 16th.
 
Last edited:
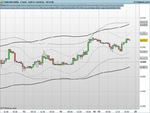
This day-trading strategy uses historical data to analyze price action based on relationships between the trend, designated sets of average price ranges and the overall 24-hour market structure across multiple time frames via "Dynamic Trailing Support and Resistance Envelopes"

I've looked around and it seems to me that the use of multiple envelopes, or "envelopes within envelopes" is somewhat of a hallmark for this approach in that I've yet to find evidence of it being used by anyone else who's been active online.
Hi Will,
I can't find any examples of what you're doing, but that merely highlights the inadequacies of the T2W search facility and/or my ability to use it! Suffice to say, the use of envelopes within envelopes isn't new. Nothing wrong that that of course, as there's precious little that is (new). If it works for you - that's all that matters.

For anyone wanting to try and produce something similar in MT4, I attach a bespoke EA I had coded up when I experimented with a similar approach a while back. From memory, it's based around the linear regression trend line and the upper and lower bands are based on + or - multiples of ATR. Keltner Channels will produce a similar result.
Tim.
 

Attachments

  • LR_ATR_v1.01.mq4
    7.4 KB · Views: 284
Long USDCAD

This is the last trade I will be posting of this particular sort, for like my failed attempt at buying USDJPY, it was made on questionable grounds.

USDCADH1-Long.pngUSDCADH1TookProfit.png

You see, I reread the description of this forum and noted that it said "use fixed rules to determine your entry and exit," but in describing this system, one of the criteria I listed was to only trade in the direction of the trend, which is not what I did in the previous trade, nor in this one.

I instead entered when it was "arguable" that the longer-term trend (as defined by the widest envelope) was neutral.

That was not really sticking to the "fixed rules," so I will endeavor to make that same mistake no more, (especially given that I also find it arguable that USDCAD might be in the process of forming a major top before heading south).

RESULT: Given the support/resistance I see at this level when I glance back to Wednesday, Thursday and Friday of last week, I opted to cash in on my gains here at 1.3200 (second chart above).
 
Last edited:
Missed Opportunity

I wanted to get in on this trade as soon as price turned north, but unfortunately, it wouldn't do so before I had to go to bed.

EURGBPM5-MissedOpportunity.png

Nonetheless, it would have easily met the system's fixed rules since there was clearly an overall uptrend (at that time) and price had pulled back to the floor of the intermediate envelope.

(The lines are squiggly because this chart is in a lower time frame [five minutes] where I use only intermittent samplings of data in order to conserve memory.)
 
I just saw where you posted related comments elsewhere, and the formulas are pretty much as you described. The details are of course proprietary (it's taken me five years to develop a methodology in which I have enough confidence to test publicly), but it essentially looks at the average price ranges within various intervals of time, and then uses that data to draw dynamic (adjusting) envelopes that define the limits beyond which price is probably not inclined to venture farther away from the associated moving average.

I'm currently long AUDUSD and will post a screen shot as soon as I'm finished responding to your inquiry here. I'll type a slightly longer explanation of my rationale than I was originally planning for the image in order to "piggy back" on what I've written here.

thanks - a nice approach .........respect (y)

N
 
Scalping has less to do with pips and ticks than it does with attitude.

As for the opinion part, it's based on many years of watching beginners and the paths they take. You are at least testing your theories, which puts you well ahead of most. Adhering to your methodology in the face of loss will be the acid test.

he shouldn't have to worry too much ..........the best traders in the world have their head together and will only panic when they are losing money where market dynamics dictate that profit should be being made

N
 
View attachment 229504View attachment 229548

The fast and intermediate envelopes seem to be offering support at this level. The longer-term envelope is arguably neutral, and this is all perhaps reason enough to enter a long position.

Looking back over the past few days, there seems to be a lot of "noise" right around the 102.05 handle, so that's where I felt comfortable placing my take profit target.

RESULT: Though it might have been "arguable" that the longer-term envelope was neutral, undeniable it clearly was not. Though I was stopped out (see second chart above) I will still be interested to see if price continues south, or if the pair just made a "last hurrah" of sorts, especially since price was rejected when it tried to fall below this level (101.80) on the 15th and 16th.

both charts look pretty neutral to me Will here .......I wouldn't be really looking to trade until I get some momentum rolling somewhere .......or go play elsewhere on the G8 where there must be plenty of opps ..especially on livelier currency pairs involving the yen and GBP

N
 
Hi Will,
I can't find any examples of what you're doing, but that merely highlights the inadequacies of the T2W search facility and/or my ability to use it! Suffice to say, the use of envelopes within envelopes isn't new. Nothing wrong that that of course, as there's precious little that is (new). If it works for you - that's all that matters.

For anyone wanting to try and produce something similar in MT4, I attach a bespoke EA I had coded up when I experimented with a similar approach a while back. From memory, it's based around the linear regression trend line and the upper and lower bands are based on + or - multiples of ATR. Keltner Channels will produce a similar result.
Tim.

Out of curiosity, I place your Linear Regression ATR indicator over my setup (the white lines) to see what I would see. Here is the result:

EURGBPH1-Comparison.png
 
Out of curiosity, I place your Linear Regression ATR indicator over my setup (the white lines) to see what I would see. . .
Hi Will,
I no longer use MT4 and I can't remember what the default settings are. Looking at the chart you posted, to get closer to your indicator, anyone interested will have to increase the ATR setting on mine - along with the look back period. Obviously, unless your indicators are calculated in the same way which, presumably, they're not - there will be differences. By the same token, unless you're willing to make yours available to members to download, then my indicator ought to serve as a half decent proxy for anyone interested to play with.
Tim.

PS.
Just had a play for fun with ProRealTime - chart attached. It's not the same as yours, but the principle's there . . .

GBP.H1.png
 
Last edited:
PS.
Just had a play for fun with ProRealTime - chart attached. It's not the same as yours, but the principle's there . . .View attachment 229566

Cool!!!

A couple of days ago I was doing some reading and based on the idea behind Keltner Channels, I thought they might make better substitutes for my envelopes (which eat a lot of memory) than standard MA envelopes, which I've found unsatisfactory.

After viewing the image you posted, I'm going to go ahead and give Keltner Channels a try. Thanks for the motivation.
 
. . .After viewing the image you posted, I'm going to go ahead and give Keltner Channels a try. Thanks for the motivation.
Hi Will,
Apologies, I think I've mislead you - albeit unintentionally. I didn't use Keltner Channels to create the chart I posted - it's a 'zero lag exponential moving average' - just one of a number of standard moving average options available with ProRealTime.

The purpose of posting it isn't really for your benefit, as I assume you're happy with your own proprietary envelopes. It is really only to show subscribers to your thread (who don't have your envelopes) that - if they liked your 'envelopes within envelopes' concept - they could achieve something similar using the tools available to them in their own TA package. If I have time later today, I might try doing the same thing using Keltner Channels.

Sorry for any confusion.
Tim.
 
Sorry for any confusion.

No confusion. I just thought Keltner Channels were worth a look based on independent reading, but whereas the Keltner Channel default setting was a close match for my narrowest channel, I was unable to adjust the ATR when I increased the look back period on the version I downloaded, so it didn't work out.

To tell you the truth, it would be of benefit to me too if there were prepackaged MT4 envelops that work the same because mine eat up a lot of memory. From just eyeballing them, my guess is that the zero lag exponential MA based envelopes available on your ProRealTime platform work just as well if not better.
 
Strategy for September 21-22, 2016

I'm assuming I won't be able to upload the video, same as yesterday, so here is the link:

Setups for September 21-22, 2016

Oh, that's right! The premise for this forum is "Use fixed rules to determine your entry and exit," so the only trades that apply from the above video are AUDUSD, EURGBP and the yen pairs. None of the other assets looked like they were trending all that well.
 
Last edited:
Forex Market Forecast / September 26-27, 2017

https://youtu.be/X_nrMdug_Zg

These are the only pairs I like for this next round of sessions:

Market Forecast 9-26-2016.png

EURGBP entered the trade zone and then reversed north but must not have hit my target because I somehow loss money on the trade. I think the problem was I entered a long position before the pair actually dropped into my designated "trade zone" and was then subsequently kicked out of the trade automatically when price hit my stop loss. (Seriously, I need to start cataloging all my trades in writing for when I forget what I did.)

Unfortunately, after reaching as high as 0.8692 the pair opted to reverse direction south and take back every bit of profit from any "longs" who did not time their exits prudently.

USDCAD generally behaved as expected, but it too failed to drop into my designated "trade zone" and since I did not enter a long position anyway (as I did with EURGBP) I did not end up benefiting from the trip north.

GBPJPY more or less behaved as expected as well except that it did enter my "trade zone" and without ultimately reversing direction, so that in this case, I fully benefited from the pair's actions.

(P.S. Once again, I just noticed this is a "fixed rules" forum, so I guess the results of my EURGBP trade is what I get for not sticking to them.)
 
Last edited:
This day-trading strategy uses historical data to analyze price action based on relationships between the trend, designated sets of average price ranges and the overall 24-hour market structure across multiple time frames via "Dynamic Trailing Support and Resistance Envelopes" as pictured here:

View attachment 229472

I've looked around and it seems to me that the use of multiple envelopes, or "envelopes within envelopes" is somewhat of a hallmark for this approach in that I've yet to find evidence of it being used by anyone else who's been active online.
where is the system?
 
Top