Will Duxon
Active member
- Messages
- 175
- Likes
- 4
I've adopted and am now testing an approach to trading foreign currency pairs that combines one-hour and one-minute charts--a methodology I'm hoping to hone to near perfection (i.e., one that results in numerous consecutive days without a single losing trade).
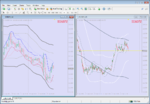
I started using the method on Friday and am posting the first day of results below. (The system initially managed about an 82% success rate.)

The idea is to use historical data to analyze typical price action based on the relationship between trend, a set of average price ranges, and current market structure. I do this primarily through the use of proprietary indicators I call “dynamic trailing support and resistance envelopes.”
I've elected to forego the use of such indicators as MACD, CCI, RSI, ADX, Stochastic Oscillators, etc., in that I see no evidence they work as well as, enhance, or confirm the above mentioned envelopes.
I started using the method on Friday and am posting the first day of results below. (The system initially managed about an 82% success rate.)
The idea is to use historical data to analyze typical price action based on the relationship between trend, a set of average price ranges, and current market structure. I do this primarily through the use of proprietary indicators I call “dynamic trailing support and resistance envelopes.”
I've elected to forego the use of such indicators as MACD, CCI, RSI, ADX, Stochastic Oscillators, etc., in that I see no evidence they work as well as, enhance, or confirm the above mentioned envelopes.


