Predicting future FX support and resistance levels using mathematics

GBPUSD predictions for 8th February

I attach the VRM predictions for GBPUSD for tonight and tomorrow finishing 5 pm 8th February in New York.

The predictions are now in chart format and CSV format for input into charting systems. Predictions are in the column format of date, high, low, close, trend channel top, bottom and middle and 24 dual columns for the VRM levels. The last entry gives today's predictions and this week's predictions. The CSV file also gives past results for the VRM for back testing trading strategies. As the current day and week have not finished, the high, low and close entries are set to zero for these dates. The FX chart corresponds to the last daily and weekly CSV file entries.

Documents describing the Volatility Response Model (VRM) and the chart format can be found on the first post of this thread.

Predictions for VRM levels of EURGBP and EURUSD and 10 other FX pairs can be found at

https://www.complexhamiltoniansystems.com/fxcharts/
 

Attachments

  • gbpusd.PNG
    gbpusd.PNG
    57.4 KB · Views: 130
  • GBP-USD-DAILY.CSV
    46 KB · Views: 161
  • GBP-USD-WEEKLY.CSV
    46 KB · Views: 145
GBPUSD results for 8th February - BoE Interest Rate Decision

Last night I attached the predicted support and resistance levels of GBPUSD of the Volatility Response Model (VRM) for today.

EURGBP and EURUSD VRM levels were on the website

https://www.complexhamiltoniansystems.com/fxcharts/

Here are the results for GBPUSD. Two charts are attached.

First chart .......Weekly VRM levels in the top 30 minute chart, daily VRM levels in the bottom 30 minute chart. Times are GMT-4 . EMA channel (4,7) included.

Second chart......5 minute chart EMA(4,7) with key daily and weekly VRM levels

Low for the day was at daily sentiment level 1.3856
High for the day was at the short term trend channel middle 1.4048

The 5 minute chart shows the price action from just before the BoE rate decision. At 8 am (GMT-4) the GBPUSD stood exactly on the daily S1 sentiment level 1.3882. In just over five minutes it raced on up to level 1.4016 before retracing to the EMA(4,7) channel. Then moved up to the short term trend channel middle 1.4048 where it bounced. Then fell back to the daily sentiment level 1.3882.

Yesterday in post #157 I gave my current trading strategy using the 5 minute EMA(4,7) chart attached today.

There were some large gaps between VRM levels to trade between.
 

Attachments

  • 2018-02-08-GBPUSD-30min.png
    2018-02-08-GBPUSD-30min.png
    141 KB · Views: 144
  • 2018-02-08-GBPUSD-5min-1800.png
    2018-02-08-GBPUSD-5min-1800.png
    110.3 KB · Views: 121
Last edited:
GBPUSD predictions for 9th February

I attach the VRM predictions for GBPUSD for tonight and tomorrow finishing 5 pm 9th February in New York.

The predictions are now in chart format and CSV format for input into charting systems. Predictions are in the column format of date, high, low, close, trend channel top, bottom and middle and 24 dual columns for the VRM levels. The last entry gives today's predictions and this week's predictions. The CSV file also gives past results for the VRM for back testing trading strategies. As the current day and week have not finished, the high, low and close entries are set to zero for these dates. The FX chart corresponds to the last daily and weekly CSV file entries.

Documents describing the Volatility Response Model (VRM) and the chart format can be found on the first post of this thread.

Predictions for VRM levels of EURGBP and EURUSD and 10 other FX pairs can be found at

https://www.complexhamiltoniansystems.com/fxcharts/

My current trading strategy is on page #20 post #157 of this thread.
 

Attachments

  • GBP-USD-WEEKLY.CSV
    46 KB · Views: 157
  • GBP-USD-DAILY.CSV
    46 KB · Views: 151
  • gbpusd.PNG
    gbpusd.PNG
    58 KB · Views: 148
Thanks. I appreciate your detailed response and your efforts here. But I think you misunderstood me. Again, this is referring to your observation of an apparent lack of interest with what you're doing here. And, the following is just my opinion.

Does the dog hunt?

Before I would read/learn/study/consider the vast information you've posted here; I'd first want to know if it 'works.'

It's not my job to piece the puzzle together and paper trade it myself to see if it hunts. That's your job. It's your dog.

If I see that it hunts. Or more specifically, if you show me that it hunts, then, and only then, would I even consider (maybe) investing time and brain power towards understanding exactly what it is you are trying to say--depending upon how well it hunts.

How do you do that?

You could get elaborate and use a service like collective2.com (C2) to build a verified track record--even a simulated one.

Or you could simply post real-time calls here. You could simply say, in real-time, when you have entered a position, and when you have exited a position.

You don't have to actually make the trades in real life. This would just be paper trading, or a proof of concept.

I find it amazing that you haven't already wanted to see for yourself whether your dog can actually hunt. :)

Point taken. I am not trading full time or half time. So trading calls would be intermittent.

Here is my current trading strategy using yesterday's GBPUSD price action as an example.

I use an Exponential Moving Average channel with sides of 4 and 7 time units. Call this EMA(4,7)

1. A trending channel has the EMA(4,7) continuing in the same direction
2. A reversal has the EMA(4,7) channel sides cross over in one candlestick AND then stay crossed over in the next candlestick. NOTE this takes two candlesticks.
3. Depending on what timescale you look at a reversal can occur at a smaller timescale while the higher timescale is still trending
4. So at a short timescale the market has reversed but at the larger timescale this is just a retracement back to the EMA(4,7) channel of a longer timescale

Trading strategy

1. Look at the EMA(4,7) for 3 hour, 30 minute and 5 minute timescales.
2. The 3 hour candlesticks start at 5 pm (GMT-4) time for me
3. Determine the trend of the 3 hour EMA(4,7). That is the optimum direction to trade in
4. About the current price of the FX draw the closest 5 VRM levels above and 5 VRM levels below on the chart
5. The price action will bounce and move through these levels
6. If the market is far away from the 3 hour EMA(4,7) expect a retracement back to this channel
7. Use the 5 minute EMA(4,7) to enter and exit the market.
8. Do not start a trade too far away from the 5 minute EMA(4,7) because there could be a retracement back to this channel.
9. Wait for the 5 minute EMA(4,7) to completely pass through or bounce off (reverse) at a VRM level.
10. Set the S/L behind a VRM level
11. Look for large gaps between VRM levels
12. Set the T/P at a VRM level padded out to cover the spread. For example the offer price may make the VRM level. But the bid price may not.
13. Weekly and daily VRM levels labelled S1 are important.
14. Trade over a 3 hour candlestick time period
15. The easiest trades are when the 5 minute , 30 minute and 3 hour EMA(4,7) channels agree in direction.
16. The sides and middles of the VRM short term and long term trend channels are key points where reversals (bounces) happen.

I attach two charts showing the GBPUSD retracement back to the 3 hour EMA(4,7) channel at 11 am (GMT-4) yesterday 6 February. First chart shows the 3 hour candlestick EMA(4,7). Second chart shows the 5 minute EMA(4,7) about this time. See the retracement on the 3 hour chart back up from VRM level 1.3859. The 5 minute chart shows this in more detail. The 5 minute candlestick chart shows clearly the price action about the VRM levels.
 
Thanks. I appreciate your detailed response and your efforts here. But I think you misunderstood me. Again, this is referring to your observation of an apparent lack of interest with what you're doing here. And, the following is just my opinion.

Does the dog hunt?

Before I would read/learn/study/consider the vast information you've posted here; I'd first want to know if it 'works.'

It's not my job to piece the puzzle together and paper trade it myself to see if it hunts. That's your job. It's your dog.

If I see that it hunts. Or more specifically, if you show me that it hunts, then, and only then, would I even consider (maybe) investing time and brain power towards understanding exactly what it is you are trying to say--depending upon how well it hunts.

How do you do that?

You could get elaborate and use a service like collective2.com (C2) to build a verified track record--even a simulated one.

Or you could simply post real-time calls here. You could simply say, in real-time, when you have entered a position, and when you have exited a position.

You don't have to actually make the trades in real life. This would just be paper trading, or a proof of concept.

I find it amazing that you haven't already wanted to see for yourself whether your dog can actually hunt. :)

In post #150 I said

"Initial feedback was negative...support and resistance levels cannot be calculated mathematically. I persisted in presenting the predictions and results and now there seem to be quite a few views and not many comments."

I did not say there was an apparent lack of interest. Quite the opposite, there are over 100 views per day on this thread. What I am looking for is feedback on how the levels compare with other technical methods of trading. For instance did anyone identify yesterday's high for the GBPUSD as accurately or more accurately than the VRM did after the BoE interest rate decision. Are there any threads on trade2Win where traders are sharing their trading strategies and exchanging ideas and having discussions back and forth on trading approaches?

I have provided thread members such as Smart_Money in posts #98, #116 and #119 with GBPUSD data for back testing but I have heard nothing more. I was hoping for feedback there. I do not have access to intraday data to carry out backtesting.
 
... I was hoping for feedback there. I do not have access to intraday data to carry out backtesting.

I view/scan/glance your thread also. Hoping that you'll, one day, reveal some evidence to show that your model can be used for actual trading.

---

I was referring to forward testing, not backtesting. One day at a time. Here. In real time.

---

You'll get plenty of feedback if you can show that your dog hunts.

---

I'm looking at free GBPUSD intraday chart data right now on tradingview.com .

---

I get it. If your goal is to only forecast and discuss what you and your models say are support and resistance levels; and not to show where you and your models can extract profits from the markets using those forecasts; then please excuse my interruption--I'll go back to my corner. :) Good luck! I'm still following your thread!
 
Last edited:
I view/scan/glance your thread also. Hoping that you'll, one day, reveal some evidence to show that your model can be used for actual trading.

---

I was referring to forward testing, not backtesting. One day at a time. Here. In real time.

---

You'll get plenty of feedback if you can show that your dog hunts.

---

I'm looking at free GBPUSD intraday chart data right now on tradingview.com .

---

I get it. If your goal is to only forecast and discuss what you and your models say are support and resistance levels; and not to show where you and your models can extract profits from the markets using those forecasts; then please excuse my interruption--I'll go back to my corner. :) Good luck! I'm still following your thread!

Thank you for the link to free intraday data.
 
GBPUSD results for 9th February

Thursday night I attached the predicted support and resistance levels of GBPUSD of the Volatility Response Model (VRM) for yesterday.

EURGBP and EURUSD VRM levels were on the website

https://www.complexhamiltoniansystems.com/fxcharts/

Here are the results for GBPUSD.

Weekly VRM levels in the top 30 minute chart, daily VRM levels in the bottom 30 minute chart. Times are GMT-4 . EMA channel (4,7) included.

High for the day was at daily level 1.3973

Low for the day was at daily level 1.3774. And this coincided with the EURUSD low for the day at its short term trend channel bottom of 1.2212.

There were some large gaps between VRM levels to trade between.
 

Attachments

  • 2018-02-09-GBPUSD-30min.png
    2018-02-09-GBPUSD-30min.png
    110.7 KB · Views: 209
GBPUSD predictions for 12th February

I attach the VRM predictions for GBPUSD for tonight and tomorrow finishing 5 pm 12th February in New York.

The predictions are now in chart format and CSV format for input into charting systems. Predictions are in the column format of date, high, low, close, trend channel top, bottom and middle and 24 dual columns for the VRM levels. The last entry gives today's predictions and this week's predictions. The CSV file also gives past results for the VRM for back testing trading strategies. As the current day and week have not finished, the high, low and close entries are set to zero for these dates. The FX chart corresponds to the last daily and weekly CSV file entries.

Documents describing the Volatility Response Model (VRM) and the chart format can be found on the first post of this thread.

Predictions for VRM levels of EURGBP and EURUSD and 10 other FX pairs can be found at

https://www.complexhamiltoniansystems.com/fxcharts/

My current trading strategy is on page #20 post #157 of this thread.
 

Attachments

  • GBP-USD-WEEKLY.CSV
    46 KB · Views: 168
  • GBP-USD-DAILY.CSV
    46 KB · Views: 190
  • gbpusd.PNG
    gbpusd.PNG
    56.9 KB · Views: 258
GBPUSD results for 12th February

Yesterday I attached the predicted support and resistance levels of GBPUSD of the Volatility Response Model (VRM) for today.

EURGBP and EURUSD VRM levels were on the website

https://www.complexhamiltoniansystems.com/fxcharts/

Here are the results for GBPUSD.

Weekly VRM levels in the top 30 minute chart, daily VRM levels in the bottom 30 minute chart. Times are GMT-4 . EMA channel (4,7) included.

High for the day was at the highest daily sentiment level 1.3869. Which was also a weekly sentiment level.
Low for the day was at the middle of the long term trend channel 1.3807

There were some large gaps between VRM levels to trade between.
 

Attachments

  • 2018-02-12-GBPUSD-30min.png
    2018-02-12-GBPUSD-30min.png
    113 KB · Views: 225
GBPUSD predictions for 13th February

I attach the VRM predictions for GBPUSD for tonight and tomorrow finishing 5 pm 13th February in New York.

The predictions are now in chart format and CSV format for input into charting systems. Predictions are in the column format of date, high, low, close, trend channel top, bottom and middle and 24 dual columns for the VRM levels. The last entry gives today's predictions and this week's predictions. The CSV file also gives past results for the VRM for back testing trading strategies. As the current day and week have not finished, the high, low and close entries are set to zero for these dates. The FX chart corresponds to the last daily and weekly CSV file entries.

Documents describing the Volatility Response Model (VRM) and the chart format can be found on the first post of this thread.

Predictions for VRM levels of EURGBP and EURUSD and 10 other FX pairs can be found at

https://www.complexhamiltoniansystems.com/fxcharts/

My current trading strategy is on page #20 post #157 of this thread.
 

Attachments

  • gbpusd.PNG
    gbpusd.PNG
    57.6 KB · Views: 219
  • GBP-USD-DAILY.CSV
    46 KB · Views: 180
  • GBP-USD-WEEKLY.CSV
    46 KB · Views: 171
GBPUSD results for 13th February

Last night I attached the predicted support and resistance levels of GBPUSD of the Volatility Response Model (VRM) for today.

EURGBP and EURUSD VRM levels were on the website

https://www.complexhamiltoniansystems.com/fxcharts/

Here are the results for GBPUSD.

Weekly VRM levels in the top 30 minute chart, daily VRM levels in the bottom 30 minute chart. Times are GMT-4 . EMA channel (4,7) included.

Low for the day was at daily sentiment level S1 1.3836
High for the day was at daily level 1.3918
Many retracements off weekly sentiment levels

There were some large gaps between VRM levels to trade between.
 

Attachments

  • 2018-02-13-GBPUSD-30min.png
    2018-02-13-GBPUSD-30min.png
    135 KB · Views: 238
GBPUSD predictions for 14th February

I attach the VRM predictions for GBPUSD for tonight and tomorrow finishing 5 pm 14th February in New York.

The predictions are now in chart format and CSV format for input into charting systems. Predictions are in the column format of date, high, low, close, trend channel top, bottom and middle and 24 dual columns for the VRM levels. The last entry gives today's predictions and this week's predictions. The CSV file also gives past results for the VRM for back testing trading strategies. As the current day and week have not finished, the high, low and close entries are set to zero for these dates. The FX chart corresponds to the last daily and weekly CSV file entries.

Documents describing the Volatility Response Model (VRM) and the chart format can be found on the first post of this thread.

Predictions for VRM levels of EURGBP and EURUSD and 10 other FX pairs can be found at

https://www.complexhamiltoniansystems.com/fxcharts/

My current trading strategy is on page #20 post #157 of this thread.
 

Attachments

  • GBP-USD-WEEKLY.CSV
    46 KB · Views: 160
  • GBP-USD-DAILY.CSV
    46 KB · Views: 169
  • gbpusd.PNG
    gbpusd.PNG
    58.1 KB · Views: 266
GBPUSD results for 14th February

Last night I attached the predicted support and resistance levels of GBPUSD of the Volatility Response Model (VRM) for today.

EURGBP and EURUSD VRM levels were on the website

https://www.complexhamiltoniansystems.com/fxcharts/

Here are the results for GBPUSD.

Weekly VRM levels in the top 30 minute chart, daily VRM levels in the bottom 30 minute chart. Times are GMT-4 . EMA channel (4,7) included.

Low for the day was at weekly long term trend channel middle 1.3807 with a 30 minute bounce off the lowest daily sentiment level 1.3835

High for the day was at weekly level 1.4019

There were some large gaps between VRM levels to trade between.
 

Attachments

  • 2018-02-14-GBPUSD-30min.png
    2018-02-14-GBPUSD-30min.png
    119.4 KB · Views: 210
GBPUSD predictions 15th February

I attach the VRM predictions for GBPUSD for tonight and tomorrow finishing 5 pm 15th February in New York.

The predictions are now in chart format and CSV format for input into charting systems. Predictions are in the column format of date, high, low, close, trend channel top, bottom and middle and 24 dual columns for the VRM levels. The last entry gives today's predictions and this week's predictions. The CSV file also gives past results for the VRM for back testing trading strategies. As the current day and week have not finished, the high, low and close entries are set to zero for these dates. The FX chart corresponds to the last daily and weekly CSV file entries.

Documents describing the Volatility Response Model (VRM) and the chart format can be found on the first post of this thread.

Predictions for VRM levels of EURGBP and EURUSD and 10 other FX pairs can be found at

https://www.complexhamiltoniansystems.com/fxcharts/

My current trading strategy is on page #20 post #157 of this thread.
 

Attachments

  • gbpusd.PNG
    gbpusd.PNG
    57.2 KB · Views: 227
  • GBP-USD-DAILY.CSV
    46 KB · Views: 181
  • GBP-USD-WEEKLY.CSV
    46 KB · Views: 182
GBPUSD results for 15th February

Last night I attached the predicted support and resistance levels of GBPUSD of the Volatility Response Model (VRM) for today.

EURGBP and EURUSD VRM levels were on the website

https://www.complexhamiltoniansystems.com/fxcharts/

Here are the results for GBPUSD. I attach two views.

First view shows weekly VRM levels in the top 30 minute chart, daily VRM levels in the bottom 30 minute chart. Times are GMT-4 . EMA channel (4,7) included.

Low for the day was at the highest daily sentiment level 1.4005. The GBPUSD was bullish at all timescales.

High for the day was at daily level 1.4102

I attach a second chart showing five minute candlesticks with an EMA (4,7) channel for the rally from daily level 1.4024 to daily level 1.4102 .

There were some large gaps between VRM levels to trade between.
 

Attachments

  • 2018-02-15-GBPUSD-30min.png
    2018-02-15-GBPUSD-30min.png
    104.6 KB · Views: 199
  • 2018-02-15-GBPUSD-5min-1710.png
    2018-02-15-GBPUSD-5min-1710.png
    92 KB · Views: 194
GBPUSD predictions for 16th February

I attach the VRM predictions for GBPUSD for tonight and tomorrow finishing 5 pm 16th February in New York.

The predictions are now in chart format and CSV format for input into charting systems. Predictions are in the column format of date, high, low, close, trend channel top, bottom and middle and 24 dual columns for the VRM levels. The last entry gives today's predictions and this week's predictions. The CSV file also gives past results for the VRM for back testing trading strategies. As the current day and week have not finished, the high, low and close entries are set to zero for these dates. The FX chart corresponds to the last daily and weekly CSV file entries.

Documents describing the Volatility Response Model (VRM) and the chart format can be found on the first post of this thread.

Predictions for VRM levels of EURGBP and EURUSD and 10 other FX pairs can be found at

https://www.complexhamiltoniansystems.com/fxcharts/

My current trading strategy is on page #20 post #157 of this thread.
 

Attachments

  • GBP-USD-WEEKLY.CSV
    46 KB · Views: 156
  • GBP-USD-DAILY.CSV
    46 KB · Views: 165
  • gbpusd.PNG
    gbpusd.PNG
    57.9 KB · Views: 275
GBPUSD , EURGBP & EURUSD results 16th February

Thursday night I attached the predicted support and resistance levels of GBPUSD of the Volatility Response Model (VRM) for yesterday.

EURGBP and EURUSD VRM levels were on the website

https://www.complexhamiltoniansystems.com/fxcharts/

Here are the results for yesterday of the triplet GBPUSD, EURGBP and EURUSD.

Weekly VRM levels in the top 30 minute charts, daily VRM levels in the bottom 30 minute charts. Times are GMT-4 . EMA channel (4,7) included.

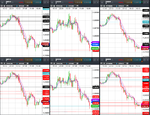
The charts show how the GBPUSD, EURGBP and EURUSD coordinated about their respective VRM levels during the day

GBPUSD and EURUSD made their highs at about the same time at their respective VRM levels 1.4144 and 1.2554 before falling during the day.

EURUSD fell to its daily low at level 1.2406 and GBPUSD made its low about level 1.4018

Meanwhile EURGBP was supported for most of the day by the daily sentiment level S1 at 0.8868 before falling to its short term trend channel middle 0.8844


There were some large gaps between VRM levels to trade between.
 

Attachments

  • 2018-02-16-GBPUSD-EURGBP-EURUSD-30min.png
    2018-02-16-GBPUSD-EURGBP-EURUSD-30min.png
    353 KB · Views: 213
GBPUSD predictions for 19th February

I attach the VRM predictions for GBPUSD for tonight and tomorrow finishing 5 pm 19th February in New York.

The predictions are now in chart format and CSV format for input into charting systems. Predictions are in the column format of date, high, low, close, trend channel top, bottom and middle and 24 dual columns for the VRM levels. The last entry gives today's predictions and this week's predictions. The CSV file also gives past results for the VRM for back testing trading strategies. As the current day and week have not finished, the high, low and close entries are set to zero for these dates. The FX chart corresponds to the last daily and weekly CSV file entries.

Documents describing the Volatility Response Model (VRM) and the chart format can be found on the first post of this thread.

Predictions for VRM levels of EURGBP and EURUSD and 10 other FX pairs can be found at

https://www.complexhamiltoniansystems.com/fxcharts/

My current trading strategy is on page #20 post #157 of this thread.
 

Attachments

  • gbpusd.PNG
    gbpusd.PNG
    58.1 KB · Views: 239
  • GBP-USD-DAILY.CSV
    46 KB · Views: 147
  • GBP-USD-WEEKLY.CSV
    46 KB · Views: 153
GBPUSD results for 19th February

Yesterday I attached the predicted support and resistance levels of GBPUSD of the Volatility Response Model (VRM) for today.

EURGBP and EURUSD VRM levels were on the website

https://www.complexhamiltoniansystems.com/fxcharts/

Here are the results for GBPUSD. Two attachments.

First attachment. Weekly VRM levels in the top 30 minute chart, daily VRM levels in the bottom 30 minute chart. Times are GMT-4 . EMA channel (4,7) included.

Low for the day was at daily level 1.3966
High for the day was at weekly sentiment level 1.4044

Second attachment shows the 5 minute chart between 8 am and 2 pm (GMT-4) over two three hour periods. EMA channel (4,7) included. There were two straight trades using my current trading strategy. One from below level 1.4022 down to level 1.3966. Second trade from above level 1.3966 up to level 1.4014.

There were some large gaps between VRM levels to trade between.
 

Attachments

  • 2018-02-19-GBPUSD-30min.png
    2018-02-19-GBPUSD-30min.png
    113.1 KB · Views: 208
  • 2018-02-19-GBPUSD-5min-1400.png
    2018-02-19-GBPUSD-5min-1400.png
    106.5 KB · Views: 208
Top