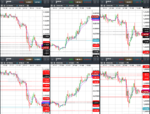
Predicting future FX support and resistance levels using mathematics

GBPUSD predictions for 30th January

I attach the VRM predictions for GBPUSD for tonight and tomorrow finishing 5 pm 30th January in New York.

The predictions are now in chart format and CSV format for input into charting systems. Predictions are in the column format of date, high, low, close, trend channel top, bottom and middle and 24 dual columns for the VRM levels. The last entry gives today's predictions and this week's predictions. The CSV file also gives past results for the VRM for back testing trading strategies. As the current day and week have not finished, the high, low and close entries are set to zero for these dates. The FX chart corresponds to the last daily and weekly CSV file entries.

Documents describing the Volatility Response Model (VRM) and the chart format can be found on the first post of this thread.

Predictions for VRM levels of EURGBP and EURUSD and 10 other FX pairs can be found at

https://www.complexhamiltoniansystems.com/fxcharts/
 

Attachments

  • gbpusd.PNG
    gbpusd.PNG
    56.6 KB · Views: 186
  • GBP-USD-DAILY.CSV
    46 KB · Views: 180
  • GBP-USD-WEEKLY.CSV
    46 KB · Views: 185
GBPUSD results for 30th Jan

Last night I attached the predicted support and resistance levels of GBPUSD of the Volatility Response Model (VRM) for today.

EURGBP and EURUSD VRM levels were on the website

https://www.complexhamiltoniansystems.com/fxcharts/

Here are the results for GBPUSD.

Weekly VRM levels in the top 30 minute chart, daily VRM levels in the bottom 30 minute chart. Times are GMT-4 . EMA channel (4,7) included.

Low for the day was at daily trend channel middle level 1.3997
High for the day was at weekly sentiment level 1.4169

There were some large gaps between VRM levels to trade between.
 

Attachments

  • 2018-01-30-GBPUSD-30min.png
    2018-01-30-GBPUSD-30min.png
    123.9 KB · Views: 185
GBPUSD predictions for 31st January

I attach the VRM predictions for GBPUSD for tonight and tomorrow finishing 5 pm 31st January in New York.

The predictions are now in chart format and CSV format for input into charting systems. Predictions are in the column format of date, high, low, close, trend channel top, bottom and middle and 24 dual columns for the VRM levels. The last entry gives today's predictions and this week's predictions. The CSV file also gives past results for the VRM for back testing trading strategies. As the current day and week have not finished, the high, low and close entries are set to zero for these dates. The FX chart corresponds to the last daily and weekly CSV file entries.

Documents describing the Volatility Response Model (VRM) and the chart format can be found on the first post of this thread.

Predictions for VRM levels of EURGBP and EURUSD and 10 other FX pairs can be found at

https://www.complexhamiltoniansystems.com/fxcharts/
 

Attachments

  • gbpusd.PNG
    gbpusd.PNG
    57 KB · Views: 219
  • GBP-USD-DAILY.CSV
    46 KB · Views: 175
  • GBP-USD-WEEKLY.CSV
    46 KB · Views: 200
GBPUSD results for 31st Jan

Last night I attached the predicted support and resistance levels of GBPUSD of the Volatility Response Model (VRM) for today.

EURGBP and EURUSD VRM levels were on the website

https://www.complexhamiltoniansystems.com/fxcharts/

I attach the results for GBPUSD, EURGBP and EURUSD to show how arbitrage is coordinated with the respective VRM levels.

Weekly VRM levels in the top 30 minute chart, daily VRM levels in the bottom 30 minute chart. Times are GMT-4 . EMA channel (4,7) included.

GBPUSD low for the day was at weekly sentiment level 1.4123
GBPUSD high for the day was at daily level 1.4228

Notice how GBPUSD falls at 3 am from level 1.4211 to 1.4123 while EURGBP rallies from level 0.8762 to level 0.8817. Then at 6 am GBPUSD rallies from its daily low to its daily high while EURGBP falls to its daily low at level 0.8742.

There were some large gaps between VRM levels to trade between.
 

Attachments

  • 2018-01-31-GBPUSD-EURGBP-EURUSD-30min.png
    2018-01-31-GBPUSD-EURGBP-EURUSD-30min.png
    261.6 KB · Views: 228
Last edited:
GBPUSD predictions for 1st February

I attach the VRM predictions for GBPUSD for tonight and tomorrow finishing 5 pm 1st February in New York.

The predictions are now in chart format and CSV format for input into charting systems. Predictions are in the column format of date, high, low, close, trend channel top, bottom and middle and 24 dual columns for the VRM levels. The last entry gives today's predictions and this week's predictions. The CSV file also gives past results for the VRM for back testing trading strategies. As the current day and week have not finished, the high, low and close entries are set to zero for these dates. The FX chart corresponds to the last daily and weekly CSV file entries.

Documents describing the Volatility Response Model (VRM) and the chart format can be found on the first post of this thread.

Predictions for VRM levels of EURGBP and EURUSD and 10 other FX pairs can be found at

https://www.complexhamiltoniansystems.com/fxcharts/
 

Attachments

  • GBP-USD-WEEKLY.CSV
    46 KB · Views: 196
  • GBP-USD-DAILY.CSV
    46 KB · Views: 182
  • gbpusd.PNG
    gbpusd.PNG
    57.4 KB · Views: 203
GBPUSD results for 1st February

Last night I attached the predicted support and resistance levels of GBPUSD of the Volatility Response Model (VRM) for today.

EURGBP and EURUSD VRM levels were on the website

https://www.complexhamiltoniansystems.com/fxcharts/

Here are the results for GBPUSD.

Weekly VRM levels in the top 30 minute chart, daily VRM levels in the bottom 30 minute chart. Times are GMT-4 . EMA channel (4,7) included.

Low for the day was at the highest weekly sentiment level 1.4169
Rallied to the daily levels 1.4252 and 1.4256
Then fell back to the sentiment level 1.4190 before finally breaking through 1.4256

There were some large gaps between VRM levels to trade between.
 

Attachments

  • 2018-02-01-GBPUSD-30min.png
    2018-02-01-GBPUSD-30min.png
    130.9 KB · Views: 213
GBPUSD predictions for 2nd February

I attach the VRM predictions for GBPUSD for tonight and tomorrow finishing 5 pm 2nd February in New York.

The predictions are now in chart format and CSV format for input into charting systems. Predictions are in the column format of date, high, low, close, trend channel top, bottom and middle and 24 dual columns for the VRM levels. The last entry gives today's predictions and this week's predictions. The CSV file also gives past results for the VRM for back testing trading strategies. As the current day and week have not finished, the high, low and close entries are set to zero for these dates. The FX chart corresponds to the last daily and weekly CSV file entries.

Documents describing the Volatility Response Model (VRM) and the chart format can be found on the first post of this thread.

Predictions for VRM levels of EURGBP and EURUSD and 10 other FX pairs can be found at

https://www.complexhamiltoniansystems.com/fxcharts/
 

Attachments

  • gbpusd.PNG
    gbpusd.PNG
    56.8 KB · Views: 198
  • GBP-USD-DAILY.CSV
    46 KB · Views: 188
  • GBP-USD-WEEKLY.CSV
    46 KB · Views: 188
GBPUSD EURGBP & EURUSD results 2 February - NON FARM PAYROLL

Thursday night I attached the predicted support and resistance levels of GBPUSD of the Volatility Response Model (VRM) for yesterday, non farm payroll day.

EURGBP and EURUSD VRM levels were on the website

https://www.complexhamiltoniansystems.com/fxcharts/

Here are the results for GBPUSD, EURGBP and EURUSD.

Weekly VRM levels in the top 30 minute chart, daily VRM levels in the bottom 30 minute chart. Times are GMT-4 . EMA channel (4,7) included.

GBPUSD high for the day was at daily sentiment level 1.4270. The highest daily sentiment level.

GBPUSD low for the day was at daily sentiment level 1.4103. Just below the short term daily trend channel middle.

I attach the EURGBP and EURUSD charts to show how these FX pairs coordinate their price action about their respective VRM levels as GBPUSD trends, retraces and reverses.

I also attach the 5 minute chart of GBPUSD to show in more detail the price action about the VRM levels from the announcement of the non-farm payroll at 9:30 (GMT-4) through to market close in New York.

There were some large gaps between VRM levels to trade between.
 

Attachments

  • 2018-02-02-GBPUSD-5min-NON-FARM-PAYROLL-4.png
    2018-02-02-GBPUSD-5min-NON-FARM-PAYROLL-4.png
    109.8 KB · Views: 165
  • 2018-02-02-GBPUSD-EURGBP-EURUSD-30min-NON-FARM-PAYROLL.png
    2018-02-02-GBPUSD-EURGBP-EURUSD-30min-NON-FARM-PAYROLL.png
    199.4 KB · Views: 162
Thursday night I attached the predicted support and resistance levels of GBPUSD of the Volatility Response Model (VRM) for yesterday, non farm payroll day.

EURGBP and EURUSD VRM levels were on the website

https://www.complexhamiltoniansystems.com/fxcharts/

Here are the results for GBPUSD, EURGBP and EURUSD.

Weekly VRM levels in the top 30 minute chart, daily VRM levels in the bottom 30 minute chart. Times are GMT-4 . EMA channel (4,7) included.

GBPUSD high for the day was at daily sentiment level 1.4270. The highest daily sentiment level.

GBPUSD low for the day was at daily sentiment level 1.4103. Just below the short term daily trend channel middle.

I attach the EURGBP and EURUSD charts to show how these FX pairs coordinate their price action about their respective VRM levels as GBPUSD trends, retraces and reverses.

I also attach the 5 minute chart of GBPUSD to show in more detail the price action about the VRM levels from the announcement of the non-farm payroll at 9:30 (GMT-4) through to market close in New York.

There were some large gaps between VRM levels to trade between.

So I presume that you are making loads of money using your technique for predicting levels, and that you post here for altruistic resons to help others see the light?

If thats not the case then what are you hoping to achieve from these posts? A job offer maybe, that someone will see a skill to employ? :cool:

This algorithm has not been going for very long. I first posted on 17th December requesting....

"I am looking for FX traders for feedback, discussions and opinions on the VRM predictions. To this end I will post predictions in this thread as markets progress."

Initial feedback was negative...support and resistance levels cannot be calculated mathematically. I persisted in presenting the predictions and results and now there seem to be quite a few views and not many comments. I myself am a mathematician and not a professional FX trader so I am learning the ropes as they say.

Here in Canada huge leverage is not allowed and margins are high. That means you need more initial capital and trading time in Canada to start earning a reasonable income. Maybe that is why European companies such as eToro do not take clients in North America.

With the posts on T2W there is some sort of track record with predictions and then results. And yes I would be interested in teaming up with a research group to take the maths further.
 
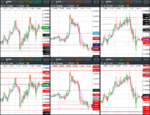
GBPUSD predictions for 5th February

I attach the VRM predictions for GBPUSD for tonight and tomorrow finishing 5 pm 5th February in New York.

The predictions are now in chart format and CSV format for input into charting systems. Predictions are in the column format of date, high, low, close, trend channel top, bottom and middle and 24 dual columns for the VRM levels. The last entry gives today's predictions and this week's predictions. The CSV file also gives past results for the VRM for back testing trading strategies. As the current day and week have not finished, the high, low and close entries are set to zero for these dates. The FX chart corresponds to the last daily and weekly CSV file entries.

Documents describing the Volatility Response Model (VRM) and the chart format can be found on the first post of this thread.

Predictions for VRM levels of EURGBP and EURUSD and 10 other FX pairs can be found at

https://www.complexhamiltoniansystems.com/fxcharts/
 

Attachments

  • gbpusd.PNG
    gbpusd.PNG
    57.8 KB · Views: 135
  • GBP-USD-DAILY.CSV
    46 KB · Views: 177
  • GBP-USD-WEEKLY.CSV
    46 KB · Views: 165
GBPUSD results for 5th February

Yesterday I attached the predicted support and resistance levels of GBPUSD of the Volatility Response Model (VRM) for today.

EURGBP and EURUSD VRM levels were on the website

https://www.complexhamiltoniansystems.com/fxcharts/

Here are the results for GBPUSD.

Weekly VRM levels in the top 30 minute chart, daily VRM levels in the bottom 30 minute chart. Times are GMT-4 . EMA channel (4,7) included.

GBPUSD started with support on the daily sentiment level 1.4090. The market was unable to pull the EMA channel through the top of the highest weekly sentiment level 1.4138 or the highest daily sentiment level 1.4131 and then fell to weekly level 1.3961.

The GBPUSD was in fact following the EURUSD at the high for the day. The EURUSD had its high at the same time at its weekly VRM level 1.2471

The short term trend channel middle of GBPUSD and EURUSD are both colliding with their respective long term trend channel tops.

There were some large gaps between VRM levels to trade between.
 

Attachments

  • 2018-02-05-GBPUSD-30min.png
    2018-02-05-GBPUSD-30min.png
    116.3 KB · Views: 134
GBPUSD & EURUSD predictions for 6th February

I attach the VRM predictions for GBPUSD for tonight and tomorrow finishing 5 pm 6th February in New York.

I also attach the EURUSD chart predictions. Both GBPUSD and EURUSD show the middle of the short term trend channel colliding with the top of their respective long term channels.

The predictions are now in chart format and CSV format for input into charting systems. Predictions are in the column format of date, high, low, close, trend channel top, bottom and middle and 24 dual columns for the VRM levels. The last entry gives today's predictions and this week's predictions. The CSV file also gives past results for the VRM for back testing trading strategies. As the current day and week have not finished, the high, low and close entries are set to zero for these dates. The FX chart corresponds to the last daily and weekly CSV file entries.

Documents describing the Volatility Response Model (VRM) and the chart format can be found on the first post of this thread.

Predictions for VRM levels of EURGBP and EURUSD and 10 other FX pairs can be found at

https://www.complexhamiltoniansystems.com/fxcharts/
 

Attachments

  • GBP-USD-WEEKLY.CSV
    46 KB · Views: 168
  • GBP-USD-DAILY.CSV
    46 KB · Views: 175
  • eurusd.PNG
    eurusd.PNG
    56.9 KB · Views: 144
  • gbpusd.PNG
    gbpusd.PNG
    57.8 KB · Views: 154
...I persisted in presenting the predictions and results and now there seem to be quite a few views and not many comments. ...

Maybe consider posting real-time trading calls; and posting the results of all of your calls daily.

Results may have a greater impact on readers than less-than-simple theories. :)
 
GBPUSD results for 6th February

Last night I attached the predicted support and resistance levels of GBPUSD of the Volatility Response Model (VRM) for today.

EURGBP and EURUSD VRM levels were on the website

https://www.complexhamiltoniansystems.com/fxcharts/

Here are the results for GBPUSD.

Weekly VRM levels in the top 30 minute chart, daily VRM levels in the bottom 30 minute chart. Times are GMT-4 . EMA channel (4,7) included.

High for the day was about the highest daily sentiment level 1.3987 as the market could not pull the EMA channel above this level
Low for the day was at daily level 1.3839

There were some large gaps between VRM levels to trade between.
 

Attachments

  • 2018-02-06-GBPUSD-30min.png
    2018-02-06-GBPUSD-30min.png
    131.2 KB · Views: 116
GBPUSD predictions for 7th February

I attach the VRM predictions for GBPUSD for tonight and tomorrow finishing 5 pm 7th February in New York.

The predictions are now in chart format and CSV format for input into charting systems. Predictions are in the column format of date, high, low, close, trend channel top, bottom and middle and 24 dual columns for the VRM levels. The last entry gives today's predictions and this week's predictions. The CSV file also gives past results for the VRM for back testing trading strategies. As the current day and week have not finished, the high, low and close entries are set to zero for these dates. The FX chart corresponds to the last daily and weekly CSV file entries.

Documents describing the Volatility Response Model (VRM) and the chart format can be found on the first post of this thread.

Predictions for VRM levels of EURGBP and EURUSD and 10 other FX pairs can be found at

https://www.complexhamiltoniansystems.com/fxcharts/
 

Attachments

  • gbpusd.PNG
    gbpusd.PNG
    57.8 KB · Views: 116
  • GBP-USD-DAILY.CSV
    46 KB · Views: 168
  • GBP-USD-WEEKLY.CSV
    46 KB · Views: 155
Trading strategy

Maybe consider posting real-time trading calls; and posting the results of all of your calls daily.

Results may have a greater impact on readers than less-than-simple theories. :)

Point taken. I am not trading full time or half time. So trading calls would be intermittent.

Here is my current trading strategy using yesterday's GBPUSD price action as an example.

I use an Exponential Moving Average channel with sides of 4 and 7 time units. Call this EMA(4,7)

1. A trending channel has the EMA(4,7) continuing in the same direction
2. A reversal has the EMA(4,7) channel sides cross over in one candlestick AND then stay crossed over in the next candlestick. NOTE this takes two candlesticks.
3. Depending on what timescale you look at a reversal can occur at a smaller timescale while the higher timescale is still trending
4. So at a short timescale the market has reversed but at the larger timescale this is just a retracement back to the EMA(4,7) channel of a longer timescale

Trading strategy

1. Look at the EMA(4,7) for 3 hour, 30 minute and 5 minute timescales.
2. The 3 hour candlesticks start at 5 pm (GMT-4) time for me
3. Determine the trend of the 3 hour EMA(4,7). That is the optimum direction to trade in
4. About the current price of the FX draw the closest 5 VRM levels above and 5 VRM levels below on the chart
5. The price action will bounce and move through these levels
6. If the market is far away from the 3 hour EMA(4,7) expect a retracement back to this channel
7. Use the 5 minute EMA(4,7) to enter and exit the market.
8. Do not start a trade too far away from the 5 minute EMA(4,7) because there could be a retracement back to this channel.
9. Wait for the 5 minute EMA(4,7) to completely pass through or bounce off (reverse) at a VRM level.
10. Set the S/L behind a VRM level
11. Look for large gaps between VRM levels
12. Set the T/P at a VRM level padded out to cover the spread. For example the offer price may make the VRM level. But the bid price may not.
13. Weekly and daily VRM levels labelled S1 are important.
14. Trade over a 3 hour candlestick time period
15. The easiest trades are when the 5 minute , 30 minute and 3 hour EMA(4,7) channels agree in direction.
16. The sides and middles of the VRM short term and long term trend channels are key points where reversals (bounces) happen.

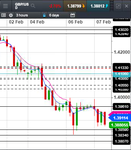
I attach two charts showing the GBPUSD retracement back to the 3 hour EMA(4,7) channel at 11 am (GMT-4) yesterday 6 February. First chart shows the 3 hour candlestick EMA(4,7). Second chart shows the 5 minute EMA(4,7) about this time. See the retracement on the 3 hour chart back up from VRM level 1.3859. The 5 minute chart shows this in more detail. The 5 minute candlestick chart shows clearly the price action about the VRM levels.
 

Attachments

  • 2018-02-06-GBPUSD-3 hour.png
    2018-02-06-GBPUSD-3 hour.png
    60.8 KB · Views: 140
  • 2018-02-06-GBPUSD-5min-2.png
    2018-02-06-GBPUSD-5min-2.png
    80.9 KB · Views: 157
Last edited:
This algorithm has not been going for very long. I first posted on 17th December requesting....

"I am looking for FX traders for feedback, discussions and opinions on the VRM predictions. To this end I will post predictions in this thread as markets progress."

Initial feedback was negative...support and resistance levels cannot be calculated mathematically. I persisted in presenting the predictions and results and now there seem to be quite a few views and not many comments. I myself am a mathematician and not a professional FX trader so I am learning the ropes as they say.

Here in Canada huge leverage is not allowed and margins are high. That means you need more initial capital and trading time in Canada to start earning a reasonable income. Maybe that is why European companies such as eToro do not take clients in North America.

With the posts on T2W there is some sort of track record with predictions and then results. And yes I would be interested in teaming up with a research group to take the maths further.

Initial feedback was CONSTRUCTIVE.

Support & Resistance concepts lead to losing money. To buy support, you have to buy a market that is moving down.

This is a suckers way to trade. You are building math to fight the market.

At what point will you be able to prove your math ends in positive expectations?

Anything other than that is mental masturbation.

With all due respect I think you have miss understood the VRM. It provides a scaffolding about which the price action moves. The VRM does not say that the market will bounce or pass through these levels. If you read through my last post describing my current trading strategy with yesterday's GBPUSD price action example you will understand the VRM in a better way.
 
GBPUSD results for 7th February

Last night I attached the predicted support and resistance levels of GBPUSD of the Volatility Response Model (VRM) for today.

EURGBP and EURUSD VRM levels were on the website

https://www.complexhamiltoniansystems.com/fxcharts/

Here are the results for GBPUSD.

Weekly VRM levels in the top 30 minute chart, daily VRM levels in the bottom 30 minute chart. Times are GMT-4 . EMA channel (4,7) included.

Market started with support on daily sentiment level 1.3951
High for the day was at daily level 1.3989
Low for the day was at daily level 1.3861 unable to pull the EMA channel down through the short term trend channel bottom 1.3855

There were some large gaps between VRM levels to trade between.
 

Attachments

  • 2018-02-07-GBPUSD-30min.png
    2018-02-07-GBPUSD-30min.png
    96.4 KB · Views: 130
Top