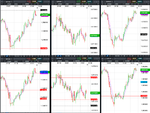
Predicting future FX support and resistance levels using mathematics

GBPUSD, EURGBP, EURUSD, USDCAD & EURCAD ---- PREDICTIONS PROVIDED IN YESTERDAY'S POST 4:04 PM T2W TIME

GBPUSD, EURGBP, EURUSD, USDCAD & EURCAD results for 13th April 2020


Volatility Response Model (VRM) described in the first post of this thread.

EURCAD added to complete another triplet. Now there are two triplets.

EURGBP X GBPUSD = EURUSD
EURUSD X USDCAD = EURCAD

The FX pairs follow each other about their respective VRM levels. Good for additional trading signals !

The daily VRM charts below now only display the highest , lowest and S1 sentiments levels. These are the most important sentiment levels.

ONE FILE ATTACHED - ALL LEVELS IN THE ATTACHED CHARTS WERE ON YESTERDAY'S POST

FIRST FILE


Weekly VRM levels in the top 30 minute charts. Daily VRM levels in the bottom 30 minute charts . Daily VRM levels only valid for the last 24 hours. Times are GMT-4 . EMA channel (4,7) included. All charts show the mid-price between the bid and the offer.

GBPUSD low at its lowest daily sentiment level 1.2448. High at its highest weekly sentiment level 1.2528

EURGBP fell as GBPUSD rose. Made its low for the day at weekly level 0.8705 / daily level 0.8705

EURUSD made its high at daily sentiment level 1.0962. Made its low as EURGBP made its low.

USDCAD supported by its highest weekly sentiment level 1.3931 until 1300 (GMT-3) Then fell with EURCAD and made its low as EURCAD made its low

EURCAD suppoprted by its weekly S1 sentiment level 1.5242. Then fell to its low at daily level 1.5122

2020-04-13-GBPUSD-EURGBP-EURUSD-USDCAD-EURCAD-30min-30min.png
 
I attach the VRM predictions for tomorrow 14th April for GBPUSD, EURGBP, EURUSD, USDCAD & EURCAD.

Coloured levels are the important VRM levels. Watch out for the top, middle and bottom of the short term trend channel (blue) colliding with the top, middle or bottom of the long term trend channel (green).

gbpusd.PNG

eurgbp.PNG

eurusd.PNG

usdcad.PNG

eurcad.PNG
 
GBPUSD, EURGBP, EURUSD, USDCAD & EURCAD ---- PREDICTIONS PROVIDED IN YESTERDAY'S POST 10:23 PM T2W TIME

GBPUSD, EURGBP, EURUSD, USDCAD & EURCAD results for 14th April 2020


Volatility Response Model (VRM) described in the first post of this thread.

EURCAD added to complete another triplet. Now there are two triplets.

EURGBP X GBPUSD = EURUSD
EURUSD X USDCAD = EURCAD

The FX pairs follow each other about their respective VRM levels. Good for additional trading signals !

The daily VRM charts below now only display the highest , lowest and S1 sentiments levels. These are the most important sentiment levels.

ONE FILE ATTACHED - ALL LEVELS IN THE ATTACHED CHARTS WERE ON YESTERDAY'S POST

FIRST FILE


Weekly VRM levels in the top 30 minute charts. Daily VRM levels in the bottom 30 minute charts . Daily VRM levels only valid for the last 24 hours. Times are GMT-4 . EMA channel (4,7) included. All charts show the mid-price between the bid and the offer.

GBPUSD The top of the GBPUSD short term trend channel for today at 1.2582 has broken through the middle of its long term trend channel at 1.2571. A major signal from the VRM algorithm for further moves upwards of the FX pair. This happened today. After support on its highest weekly sentiment level 1.2528, GBPUSD cascaded up its daily levels

EURGBP low for the day at daily level 0.8683. High for the day at daily S1 sentiment level 0.8733

EURUSD found support on its lowest daily sentiment level 1.0922. And finally managed to break through the middle of its long term trend channel at 1.0971

USDCAD moved sideways with some support on its weekly S1 sentiment level 1.3881

EURCAD found support on its lowest daily sentiment level 1.5155. And rose to its high at the middle of its short term trend channel at 1.5276

2020-04-14-GBPUSD-EURGBP-EURUSD-USDCAD-EURCAD-30min-30min.png
 
I attach the VRM predictions for tomorrow 15th April for GBPUSD, EURGBP, EURUSD, USDCAD & EURCAD.

Coloured levels are the important VRM levels. Watch out for the top, middle and bottom of the short term trend channel (blue) colliding with the top, middle or bottom of the long term trend channel (green).

gbpusd.PNG

eurgbp.PNG

eurusd.PNG

usdcad.PNG

eurcad.PNG
 
GBPUSD, EURGBP, EURUSD, USDCAD & EURCAD ---- PREDICTIONS PROVIDED IN YESTERDAY'S POST 10:51 PM T2W TIME

GBPUSD, EURGBP, EURUSD, USDCAD & EURCAD results for 15th April 2020


Volatility Response Model (VRM) described in the first post of this thread.

EURCAD added to complete another triplet. Now there are two triplets.

EURGBP X GBPUSD = EURUSD
EURUSD X USDCAD = EURCAD

The FX pairs follow each other about their respective VRM levels. Good for additional trading signals !

The daily VRM charts below now only display the highest , lowest and S1 sentiments levels. These are the most important sentiment levels.

TWO FILES ATTACHED - ALL LEVELS IN THE ATTACHED CHARTS WERE ON YESTERDAY'S POST

FIRST FILE


Weekly VRM levels in the top 30 minute charts. Daily VRM levels in the bottom 30 minute charts . Daily VRM levels only valid for the last 24 hours. Times are GMT-3 . EMA channel (4,7) included. All charts show the mid-price between the bid and the offer.

GBPUSD fell to its low at weekly S1 sentiment level 1.2440

EURGBP trapped between daily level 0.8737 and daily sentiment level 0.8697

EURUSD followed GBPUSD and made its daily low when GBPUSD made its low

USDCAD rose from weekly S1 sentiment level 1.3881. Made its high when EURCAD made its high

EURCAD low at its daily sentiment level 1.5244. High at its highest weekly sentiment level; 1.5402

SECOND FILE FOR GBPUSD, EURGBP & EURUSD

Weekly VRM levels in the top 5 minute charts. Daily VRM levels in the bottom 5 minute charts . Daily VRM levels only valid for the last 24 hours. Times are GMT-3 . EMA channel (4,7) included. All charts show the mid-price between the bid and the offer. Shows GBPUSD, EURGBP and EURUSD snapshot as their price actions coordinate about their respective VRM levels

2020-04-15-GBPUSD-EURGBP-EURUSD-USDCAD-EURCAD-30min-30min.png

2020-04-15-1252-GBPUSD-EURGBP-EURUSD-5min-5min.png
 
I attach the VRM predictions for tomorrow 16th April for GBPUSD, EURGBP, EURUSD, USDCAD & EURCAD.

Coloured levels are the important VRM levels. Watch out for the top, middle and bottom of the short term trend channel (blue) colliding with the top, middle or bottom of the long term trend channel (green).

gbpusd.PNG

eurgbp.PNG

eurusd.PNG

usdcad.PNG

eurcad.PNG
 
GBPUSD, EURGBP, EURUSD, USDCAD & EURCAD ---- PREDICTIONS PROVIDED IN YESTERDAY'S POST 10:24 PM T2W TIME

GBPUSD, EURGBP, EURUSD, USDCAD & EURCAD results for 16th April 2020


Volatility Response Model (VRM) described in the first post of this thread.

EURCAD added to complete another triplet. Now there are two triplets.

EURGBP X GBPUSD = EURUSD
EURUSD X USDCAD = EURCAD

The FX pairs follow each other about their respective VRM levels. Good for additional trading signals !

The daily VRM charts below now only display the highest , lowest and S1 sentiments levels. These are the most important sentiment levels.

ONE FILE ATTACHED - ALL LEVELS IN THE ATTACHED CHARTS WERE ON YESTERDAY'S POST

FIRST FILE


Weekly VRM levels in the top 30 minute charts. Daily VRM levels in the bottom 30 minute charts . Daily VRM levels only valid for the last 24 hours. Times are GMT-4 . EMA channel (4,7) included. All charts show the mid-price between the bid and the offer.

GBPUSD high at its highest weekly sentiment level 1.2528. Low at daily level 1.2422

EURGBP trapped on the topside by daily S1 sentiment level 0.8721 and on the bottom side by weekly level 0.8705

EURUSD fell down through daily S1 sentiment level 1.0916. Low at daily level 1.0814

USDCAD low at daily sentiment level 1.4058. High at daily level 1.4184

EURCAD high at its highest weekly sentiment level 1.5402. Low at daily level 1.5264

2020-04-16-GBPUSD-EURGBP-EURUSD-USDCAD-EURCAD-30min-30min.png
 
I attach the VRM predictions for tomorrow 17th April for GBPUSD, EURGBP, EURUSD, USDCAD & EURCAD.

Coloured levels are the important VRM levels. Watch out for the top, middle and bottom of the short term trend channel (blue) colliding with the top, middle or bottom of the long term trend channel (green).

gbpusd.PNG

eurgbp.PNG

eurusd.PNG

usdcad.PNG

eurcad.PNG
 
GBPUSD, EURGBP, EURUSD, USDCAD & EURCAD ---- PREDICTIONS PROVIDED IN YESTERDAY'S THURSDAY'S POST 10:09 PM T2W LOCAL TIME

GBPUSD, EURGBP, EURUSD, USDCAD & EURCAD results for 17th April 2020


Volatility Response Model (VRM) described in the first post of this thread.

EURCAD added to complete another triplet. Now there are two triplets.

EURGBP X GBPUSD = EURUSD

EURUSD X USDCAD = EURCAD

The FX pairs follow each other about their respective VRM levels. Good for additional trading signals !

The daily VRM charts below now only display the highest , lowest and S1 sentiments levels. These are the most important sentiment levels.

2 FILES ATTACHED - ALL LEVELS IN THE ATTACHED CHARTS WERE ON LAST POST

FIRST FILE


Weekly VRM levels in the top 30 minute charts. Daily VRM levels in the bottom 30 minute charts . Daily VRM levels only valid for the last 24 hours. Times are GMT-3. EMA channel (4,7) included. All charts show the mid-price between the bid and the offer.

GBPUSD low at daily level 1.2406. High at daily level 1.2524. I have the day's low as 1.24067. I have the day's high as 1.25233.

EURGBP moved sideways unable to become bullish or bearish as it wandered between daily sentiment level 0.8709 and 0.8695

EURUSD low at daily level 1.0825. High at its highest daily sentiment level 1.0885

USDCAD fell to its low at daily level 1.4014 as EURUSD rose to its weekly sentiment level 1.0879. Then rose as EURUSD made its low. Then fell back to its daily level 1.4014

EURCAD moved sideways unable to break through the middle of its short term trend channel 1.5273 or the middle of its long term trend channel 1.5237

SECOND FILE

Shows the 3 hour candlestick charts with EMA channel (4.7) throughout the week with weekly VRM levels for the 5 FX pairs. All charts show the mid-price between the bid and the offer.

GBPUSD made an attempt at breaking up through weekly level 1.2662 and failed. Then fell back to its weekly S1 sentiment level 1.2440

EURGBP fell to its weekly level 0.8705 then meandered about this level for the rest of the week

EURUSD rose to its highest weekly sentiment level 1.0980. Then fell to weekly level 1.0842

USDCAD started with support on its weekly S1 sentiment level 1.3881. Rose to weekly level 1.4187. Then fell

EURCAD fell to its weekly level 1.5141. Rose to its highest weekly sentiment level 1.5402. Then fell to its weekly S1 sentiment level 1.5242

2020-04-17-GBPUSD-EURGBP-EURUSD-USDCAD-EURCAD-30min-30min.png

2020-04-17-GBPUSD-EURGBP-EURUSD-USDCAD-EURCAD-3hr.png
 
Last edited:
I attach the VRM predictions for tomorrow 20th April for GBPUSD, EURGBP, EURUSD, USDCAD & EURCAD.

Coloured levels are the important VRM levels. Watch out for the top, middle and bottom of the short term trend channel (blue) colliding with the top, middle or bottom of the long term trend channel (green).

gbpusd.PNG

eurgbp.PNG

eurusd.PNG

usdcad.PNG

eurcad.PNG
 
GBPUSD, EURGBP, EURUSD, USDCAD & EURCAD ---- PREDICTIONS PROVIDED IN YESTERDAY'S POST 9:25 PM T2W TIME

GBPUSD, EURGBP, EURUSD, USDCAD & EURCAD results for 20th April 2020


Volatility Response Model (VRM) described in the first post of this thread.

EURCAD added to complete another triplet. Now there are two triplets.

EURGBP X GBPUSD = EURUSD
EURUSD X USDCAD = EURCAD

The FX pairs follow each other about their respective VRM levels. Good for additional trading signals !

The daily VRM charts below now only display the highest , lowest and S1 sentiments levels. These are the most important sentiment levels.

ONE FILE ATTACHED - ALL LEVELS IN THE ATTACHED CHARTS WERE ON YESTERDAY'S POST

FIRST FILE


Weekly VRM levels in the top 30 minute charts. Daily VRM levels in the bottom 30 minute charts . Daily VRM levels only valid for the last 24 hours. Times are GMT-4 . EMA channel (4,7) included. All charts show the mid-price between the bid and the offer.

GBPUSD high at its daily S1 sentiment level 1.2497. Low at daily level 1.2418

EURGBP supported at its weekly S1 sentiment level 0.8695. High at its weekly sentiment level 0.8743

EURUSD moved sideways betwee its daily level 1.0846 and its weekly S1 sentiment level 1.0892

USDCAD cascaded up through its daily levels and made its high as EURCAD made its high

EURCAD found support on the middle of its short term trend channel at 1.5270. Rose to weekly level 1.5368

2020-04-20-GBPUSD-EURGBP-EURUSD-USDCAD-EURCAD-30min-30min.png
 
I attach the VRM predictions for tomorrow 21st April for GBPUSD, EURGBP, EURUSD, USDCAD & EURCAD.

Coloured levels are the important VRM levels. Watch out for the top, middle and bottom of the short term trend channel (blue) colliding with the top, middle or bottom of the long term trend channel (green).

gbpusd.PNG

eurgbp.PNG

eurusd.PNG

usdcad.PNG

eurcad.PNG
 
GBPUSD, EURGBP, EURUSD, USDCAD & EURCAD ---- PREDICTIONS PROVIDED IN YESTERDAY'S POST 10:20 PM T2W TIME

GBPUSD, EURGBP, EURUSD, USDCAD & EURCAD results for 21st April 2020


Volatility Response Model (VRM) described in the first post of this thread.

EURCAD added to complete another triplet. Now there are two triplets.

EURGBP X GBPUSD = EURUSD
EURUSD X USDCAD = EURCAD

The FX pairs follow each other about their respective VRM levels. Good for additional trading signals !

The daily VRM charts below now only display the highest , lowest and S1 sentiments levels. These are the most important sentiment levels.

ONE FILE ATTACHED - ALL LEVELS IN THE ATTACHED CHARTS WERE ON YESTERDAY'S POST

FIRST FILE


Weekly VRM levels in the top 30 minute charts. Daily VRM levels in the bottom 30 minute charts . Daily VRM levels only valid for the last 24 hours. Times are GMT-4 . EMA channel (4,7) included. All charts show the mid-price between the bid and the offer.

GBPUSD cascaded down its VRM levels and fell out of the bottom of its short term trend channel at 1.2306

EURGBP supported by the middle of its short term trend channel at 0.8725. And rose to its daily high at the middle of its long term trend channel at 0.8864. I have EURGBP high for today at 0.88644

EURUSD moved sideways between its daily S1 sentiment level 1.0873 and its daily level 1.0818

USDCAD cascaded up its level;s to make a high at weekly level 1.4252

EURCAD moved sideways intially. Then rallied to its high at daily level 1.5459

2020-04-21-GBPUSD-EURGBP-EURUSD-USDCAD-EURCAD-30min-30min.png
 
I attach the VRM predictions for tomorrow 22nd April for GBPUSD, EURGBP, EURUSD, USDCAD & EURCAD.

Coloured levels are the important VRM levels. Watch out for the top, middle and bottom of the short term trend channel (blue) colliding with the top, middle or bottom of the long term trend channel (green).

gbpusd.PNG

eurgbp.PNG

eurusd.PNG

usdcad.PNG

eurcad.PNG
 
GBPUSD, EURGBP, EURUSD, USDCAD & EURCAD ---- PREDICTIONS PROVIDED IN YESTERDAY'S POST 10:26 PM T2W TIME

GBPUSD, EURGBP, EURUSD, USDCAD & EURCAD results for 22nd April 2020


Volatility Response Model (VRM) described in the first post of this thread.

EURCAD added to complete another triplet. Now there are two triplets.

EURGBP X GBPUSD = EURUSD
EURUSD X USDCAD = EURCAD

The FX pairs follow each other about their respective VRM levels. Good for additional trading signals !

The daily VRM charts below now only display the highest , lowest and S1 sentiments levels. These are the most important sentiment levels.

ONE FILE ATTACHED - ALL LEVELS IN THE ATTACHED CHARTS WERE ON YESTERDAY'S POST

FIRST FILE


Weekly VRM levels in the top 30 minute charts. Daily VRM levels in the bottom 30 minute charts . Daily VRM levels only valid for the last 24 hours. Times are GMT-4 . EMA channel (4,7) included. All charts show the mid-price between the bid and the offer.

GBPUSD low at weekly level 1.2275. High at daily level 1.2370

EURGBP unable to break up through the top of its short term trend channel at 0.8834. And fell to its low at weekly level 0.8775

EURUSD high at daily sentiment level 1.0878. Low at lowest weekly sentiment level 1.0806

USDCAD unable to break up through weekly level 1.4220. And fell to daily level 1.4130

EURCAD unable to break up through highest daily sentiment level 1.5431. And fell to daily level 1.5299

2020-04-22-GBPUSD-EURGBP-EURUSD-USDCAD-EURCAD-30min-30min.png
 
I attach the VRM predictions for tomorrow 23rd April for GBPUSD, EURGBP, EURUSD, USDCAD & EURCAD.

Coloured levels are the important VRM levels. Watch out for the top, middle and bottom of the short term trend channel (blue) colliding with the top, middle or bottom of the long term trend channel (green).
 

Attachments

  • gbpusd.PNG
    gbpusd.PNG
    64 KB · Views: 106
  • eurgbp.PNG
    eurgbp.PNG
    62.8 KB · Views: 98
  • eurusd.PNG
    eurusd.PNG
    63.8 KB · Views: 103
  • usdcad.PNG
    usdcad.PNG
    61.6 KB · Views: 96
  • eurcad.PNG
    eurcad.PNG
    61.6 KB · Views: 100
GBPUSD, EURGBP, EURUSD, USDCAD & EURCAD ---- PREDICTIONS PROVIDED IN YESTERDAY'S POST 10:46 PM T2W TIME

GBPUSD, EURGBP, EURUSD, USDCAD & EURCAD results for 23rd April 2020


Volatility Response Model (VRM) described in the first post of this thread.

EURCAD added to complete another triplet. Now there are two triplets.

EURGBP X GBPUSD = EURUSD
EURUSD X USDCAD = EURCAD

The FX pairs follow each other about their respective VRM levels. Good for additional trading signals !

The daily VRM charts below now only display the highest , lowest and S1 sentiments levels. These are the most important sentiment levels.

TWO FILES ATTACHED - ALL LEVELS IN THE ATTACHED CHARTS WERE ON YESTERDAY'S POST

FIRST FILE


Weekly VRM levels in the top 30 minute charts. Daily VRM levels in the bottom 30 minute charts . Daily VRM levels only valid for the last 24 hours. Times are GMT-4 . EMA channel (4,7) included. All charts show the mid-price between the bid and the offer.

GBPUSD continued upwards from yesterday's support off weekly sentiment level 1.2304. High at daily level 1.2405

EURGBP fell from its weekly level 0.8775. Low at daily level 0.8707

EURUSD high at daily S1 sentiment level 1.0838. Low at the bottom of its short term trend channel 1.0764

USDCAD high at the top of its short term trend channel 1.4199. Low at the middle of its short term trend channel 1.4009

EURCAD fell through the middle of its short term trend channel at 1.5321. Low at its daily level 1.5146

SECOND FILE

Three successful long trades at the bottom of USDCAD price action near the middle of its short term trend channel at 1.4009


2020-04-23-GBPUSD-EURGBP-EURUSD-USDCAD-EURCAD-30min-30min.png

2020-04-23-USDCAD-3-trades-at-short-term-trend-midddle-1.4009.png
 
I attach the VRM predictions for tomorrow for 24th April for GBPUSD, EURGBP, EURUSD, USDCAD & EURCAD.

Coloured levels are the important VRM levels. Watch out for the top, middle and bottom of the short term trend channel (blue) colliding with the top, middle or bottom of the long term trend channel (green).

gbpusd.PNG

eurgbp.PNG

eurusd.PNG

usdcad.PNG

eurcad.PNG
 
GBPUSD, EURGBP, EURUSD, USDCAD & EURCAD ---- PREDICTIONS PROVIDED IN THURSDAY'S POST 11:21 PM T2W LOCAL TIME

GBPUSD, EURGBP, EURUSD, USDCAD & EURCAD results for 24th April 2020


Volatility Response Model (VRM) described in the first post of this thread.

EURCAD added to complete another triplet. Now there are two triplets.

EURGBP X GBPUSD = EURUSD

EURUSD X USDCAD = EURCAD

The FX pairs follow each other about their respective VRM levels. Good for additional trading signals !

The daily VRM charts below now only display the highest , lowest and S1 sentiments levels. These are the most important sentiment levels.

2 FILES ATTACHED - ALL LEVELS IN THE ATTACHED CHARTS WERE ON LAST POST

FIRST FILE


Weekly VRM levels in the top 30 minute charts. Daily VRM levels in the bottom 30 minute charts . Daily VRM levels only valid for the last 24 hours. Times are GMT-3. EMA channel (4,7) included. All charts show the mid-price between the bid and the offer.

GBPUSD low at daily level 1.2303 / weekly sentiment level 1.2304. High at daily S1 sentiment level 1.2364

EURGBP low at weekly level 1.8719. High when EURUSD reached its highest daily sentiment level

EURUSD low at daily level 1.0727. High at daily level 1.0823

USDCAD low at the middle of its short term trend channel 1.4029. High at daily level 1.4112

EURCAD low at daily level 1.5116. High at daily level 1.5261

SECOND FILE

Shows the 3 hour candlestick charts with EMA channel (4.7) throughout the week with weekly VRM levels for the 5 FX pairs. All charts show the mid-price between the bid and the offer.

GBPUSD fell from the middle of its long term trend channel at 1.2508. Low at weekly level 1.2275

EURGBP rose from its weekly S1 sentiment level 0.8695. High at the middle of its long term trend channel at 0.8864

EURUSD fell from its weekly S1 sentiment level 1.0892. Low at weekly level 1.0737

USDCAD rose to weekly level 1.4252. Fell back for the rest of the week

EURCAD rose to weekly level 1.5426. Fell back for the rest of the week

2020-04-24-GBPUSD-EURGBP-EURUSD-USDCAD-EURCAD-30min-30min.png

2020-04-24-GBPUSD-EURGBP-EURUSD-USDCAD-EURCAD-3hr.png
 
I attach the VRM predictions for tomorrow for 27th April for GBPUSD, EURGBP, EURUSD, USDCAD & EURCAD.

Coloured levels are the important VRM levels. Watch out for the top, middle and bottom of the short term trend channel (blue) colliding with the top, middle or bottom of the long term trend channel (green).

gbpusd.PNG

eurgbp.PNG

eurusd.PNG

usdcad.PNG

eurcad.PNG
 
Top