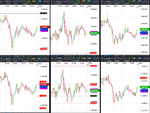
Predicting future FX support and resistance levels using mathematics

GBPUSD, EURGBP, EURUSD, USDCAD & EURCAD ---- PREDICTIONS PROVIDED IN YESTERDAY'S POST 4:48 PM UK LOCAL TIME

GBPUSD, EURGBP, EURUSD, USDCAD & EURCAD results for 30th March 2020


Volatility Response Model (VRM) described in the first post of this thread.

EURCAD added to complete another triplet. Now there are two triplets.

EURGBP X GBPUSD = EURUSD
EURUSD X USDCAD = EURCAD

The FX pairs follow each other about their respective VRM levels. Good for additional trading signals !

The daily VRM charts below now only display the highest , lowest and S1 sentiments levels. These are the most important sentiment levels.

ONE FILE ATTACHED - ALL LEVELS IN THE ATTACHED CHARTS WERE ON YESTERDAY'S POST

FIRST FILE


Weekly VRM levels in the top 30 minute charts. Daily VRM levels in the bottom 30 minute charts . Daily VRM levels only valid for the last 24 hours. Times are GMT-4 . EMA channel (4,7) included. All charts show the mid-price between the bid and the offer.

GBPUSD high about its weekly sentiment level 1.2445. Low at daily level 1.2323

EURGBP high at weekly sentiment level 0.8987. Low at daily level 0.8867

EURUSD high at daily level 1.1138. Low at daily level 1.1016

USDCAD rose from the open and found support at its daily level 1.4033. High at daily level 1.4187

EURCAD high at daily level 1.5648. Low at lowest daily sentiment level 1.5543

2020-03-30-GBPUSD-EURGBP-EURUSD-USDCAD-EURCAD-30min-30min.png
 
I attach the VRM predictions for tomorrow 31st March for GBPUSD, EURGBP, EURUSD, USDCAD & EURCAD.

Coloured levels are the important VRM levels. Watch out for the top, middle and bottom of the short term trend channel (blue) colliding with the top, middle or bottom of the long term trend channel (green).

gbpusd.PNG

eurgbp.PNG

eurusd.PNG

usdcad.PNG

eurcad.PNG
 
GBPUSD, EURGBP, EURUSD, USDCAD & EURCAD ---- PREDICTIONS PROVIDED IN YESTERDAY'S POST 10:06 PM UK LOCAL TIME

GBPUSD, EURGBP, EURUSD, USDCAD & EURCAD results for 31st March 2020


Volatility Response Model (VRM) described in the first post of this thread.

EURCAD added to complete another triplet. Now there are two triplets.

EURGBP X GBPUSD = EURUSD
EURUSD X USDCAD = EURCAD

The FX pairs follow each other about their respective VRM levels. Good for additional trading signals !

The daily VRM charts below now only display the highest , lowest and S1 sentiments levels. These are the most important sentiment levels.

ONE FILE ATTACHED - ALL LEVELS IN THE ATTACHED CHARTS WERE ON YESTERDAY'S POST

FIRST FILE


Weekly VRM levels in the top 30 minute charts. Daily VRM levels in the bottom 30 minute charts . Daily VRM levels only valid for the last 24 hours. Times are GMT-4 . EMA channel (4,7) included. All charts show the mid-price between the bid and the offer.

Some extreme volitilty of GBPUSD, EURGBP & EURUSD in 21:30 (GMT-4) candlestick. Don't know the cause. EURUSD stopped the move as it bounced off daily level 1.0986

GBPUSD made a smooth low at the top of its short term trend channel 1.2292. High at daily level 1.2473
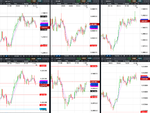
EURGBP high at daily level 0.8944. Low at daily level 0.8812

EURUSD high at the top of its short term trend channel 1.1051. Low at daily level/weekly level 1.0931

USDCAD high at weekly level 1.4346. Low at its lowest daily sentiment level 1.4042

EURCAD high at daily level 1.5712. Low at the top of its long term trend channel 1.5487

2020-03-31-GBPUSD-EURGBP-EURUSD-USDCAD-EURCAD-30min-30min.png
 
I attach the VRM predictions for tomorrow 1st April for GBPUSD, EURGBP, EURUSD, USDCAD & EURCAD.

Coloured levels are the important VRM levels. Watch out for the top, middle and bottom of the short term trend channel (blue) colliding with the top, middle or bottom of the long term trend channel (green).

gbpusd.PNG

eurgbp.PNG

eurusd.PNG

usdcad.PNG

eurcad.PNG
 
GBPUSD, EURGBP, EURUSD, USDCAD & EURCAD ---- PREDICTIONS PROVIDED IN YESTERDAY'S POST 10:15 PM UK LOCAL TIME

GBPUSD, EURGBP, EURUSD, USDCAD & EURCAD results for 1st April 2020


Volatility Response Model (VRM) described in the first post of this thread.

EURCAD added to complete another triplet. Now there are two triplets.

EURGBP X GBPUSD = EURUSD
EURUSD X USDCAD = EURCAD

The FX pairs follow each other about their respective VRM levels. Good for additional trading signals !

The daily VRM charts below now only display the highest , lowest and S1 sentiments levels. These are the most important sentiment levels.

ONE FILE ATTACHED - ALL LEVELS IN THE ATTACHED CHARTS WERE ON YESTERDAY'S POST

FIRST FILE


Weekly VRM levels in the top 30 minute charts. Daily VRM levels in the bottom 30 minute charts . Daily VRM levels only valid for the last 24 hours. Times are GMT-4 . EMA channel (4,7) included. All charts show the mid-price between the bid and the offer.

GBPUSD high about daily level 1.2424. Low at daily level 1.2337

EURGBP high at weekly level 0.8911. Low at weekly level 0.8785

EURUSD looked on at the start of the 24 hours. Then fell through daily S1 sentiment level 1.1018. Low at weekly level 1.0910

USDCAD low at daily S1 sentiment level 1.4069. High at daily level 1.4251

EURCAD high at weekly level 1.5593. Low about the lowest daily sentiment level 1.5468

2020-04-01-GBPUSD-EURGBP-EURUSD-USDCAD-EURCAD-30min-30min.png
 
I attach the VRM predictions for tomorrow 2nd April for GBPUSD, EURGBP, EURUSD, USDCAD & EURCAD.

Coloured levels are the important VRM levels. Watch out for the top, middle and bottom of the short term trend channel (blue) colliding with the top, middle or bottom of the long term trend channel (green).

gbpusd.PNG

eurgbp.PNG

eurusd.PNG

usdcad.PNG

eurcad.PNG
 
GBPUSD, EURGBP, EURUSD, USDCAD & EURCAD ---- PREDICTIONS PROVIDED IN YESTERDAY'S POST 11:02 PM T2W TIME

GBPUSD, EURGBP, EURUSD, USDCAD & EURCAD results for 2nd April 2020


Volatility Response Model (VRM) described in the first post of this thread.

EURCAD added to complete another triplet. Now there are two triplets.

EURGBP X GBPUSD = EURUSD
EURUSD X USDCAD = EURCAD

The FX pairs follow each other about their respective VRM levels. Good for additional trading signals !

The daily VRM charts below now only display the highest , lowest and S1 sentiments levels. These are the most important sentiment levels.

ONE FILE ATTACHED - ALL LEVELS IN THE ATTACHED CHARTS WERE ON YESTERDAY'S POST

FIRST FILE


Weekly VRM levels in the top 30 minute charts. Daily VRM levels in the bottom 30 minute charts . Daily VRM levels only valid for the last 24 hours. Times are GMT-4 . EMA channel (4,7) included. All charts show the mid-price between the bid and the offer.

GBPUSD high at daily level 1.2458. Low at weekly sentiment level 1.2360. So far failed to close the day below the bottom of its long term trend channel at 1.2374

EURGBP high at daily S1 sentiment level 0.8864. Low at weekly level 0.8753

EURUSD high at the middle of its short term trend channel 1.0962. Low at weekly level 1.0823

USDCAD high at daily level 1.4286. Low at the middle of its short term trend channel at 1.4084

EURCAD high at its highest daily sentiment level 1.5565. Low at weekly level 1.5337

2020-04-02-GBPUSD-EURGBP-EURUSD-USDCAD-EURCAD-30min-30min.png
 
I attach the VRM predictions for tomorrow 3rd April for GBPUSD, EURGBP, EURUSD, USDCAD & EURCAD.

Coloured levels are the important VRM levels. Watch out for the top, middle and bottom of the short term trend channel (blue) colliding with the top, middle or bottom of the long term trend channel (green).

gbpusd.PNG

eurgbp.PNG

eurusd.PNG

usdcad.PNG

eurcad.PNG
 
GBPUSD, EURGBP, EURUSD, USDCAD & EURCAD ---- PREDICTIONS PROVIDED IN YESTERDAY'S POST 10:34 PM T2W LOCAL TIME

GBPUSD, EURGBP, EURUSD, USDCAD & EURCAD results for3rd April 2020 - US Nonfarm payrolls


Volatility Response Model (VRM) described in the first post of this thread.

EURCAD added to complete another triplet. Now there are two triplets.

EURGBP X GBPUSD = EURUSD

EURUSD X USDCAD = EURCAD

The FX pairs follow each other about their respective VRM levels. Good for additional trading signals !

Here are the results for the GBPUSD, EURGBP, EURUSD, USDCAD & EURCAD at end of day 3rd April 2020

The daily VRM charts below now only display the highest , lowest and S1 sentiments levels. These are the most important sentiment levels.

2 FILES ATTACHED - ALL LEVELS IN THE ATTACHED CHARTS WERE ON YESTERDAY'S POST

FIRST FILE


Weekly VRM levels in the top 30 minute charts. Daily VRM levels in the bottom 30 minute charts . Daily VRM levels only valid for the last 24 hours. Times are GMT-3. EMA channel (4,7) included. All charts show the mid-price between the bid and the offer.

GBPUSD high at start of 24 hours at daily S1 sentiment level 1.2409. Low at daily level 1.2200

EURGBP low at daily level 0.8743. High at the bottom of its short term trend channel 0.8835

EURUSD high at its lowest daily sentiment level 1.0857. Low at daily level 1.0770

USDCAD high at daily level 1.4217. Low at weekly level 1.4101

EURCAD high at its highest daily sentiment level 1.5376. Low at daily level 1.5208

SECOND FILE

Shows the 3 hour candlestick charts with EMA channel (4.7) throughout the week with weekly VRM levels for the 5 FX pairs. All charts show the mid-price between the bid and the offer.

GBPUSD unable to break up through weekly sentiment level 1.2446. Then fell through the weekly S1 sentiment level 1.2280. And so was unable to close the week inside its long term trend channel.

EURGBP high for the week at its weekly S1 sentiment level 0.8976. Then cascaded down all its weekly levels

EURUSD broke down through weekly S1 sentiment level 1.1087. Then cascaded down through all its weekly levels

USDCAD trapped between weekly levels 1.4346 and 1.4101

EURCAD made its weekly high when USDCAD made its weekly high. Then cascaded down its weekly levels. to the bottom of its short term trend channel

2020-04-03-GBPUSD-EURGBP-EURUSD-USDCAD-EURCAD-30min-30min.png

2020-04-03-GBPUSD-EURGBP-EURUSD-USDCAD-EURCAD-3hr.png
 
I attach the VRM predictions for tomorrow 6th April for GBPUSD, EURGBP, EURUSD, USDCAD & EURCAD.

Coloured levels are the important VRM levels. Watch out for the top, middle and bottom of the short term trend channel (blue) colliding with the top, middle or bottom of the long term trend channel (green).

gbpusd.PNG

eurgbp.PNG

eurusd.PNG

usdcad.PNG

eurcad.PNG
 
GBPUSD, EURGBP, EURUSD, USDCAD & EURCAD ---- PREDICTIONS PROVIDED IN YESTERDAY'S POST 3:15 PM T2W TIME

GBPUSD, EURGBP, EURUSD, USDCAD & EURCAD results for 6th April 2020


Volatility Response Model (VRM) described in the first post of this thread.

EURCAD added to complete another triplet. Now there are two triplets.

EURGBP X GBPUSD = EURUSD
EURUSD X USDCAD = EURCAD

The FX pairs follow each other about their respective VRM levels. Good for additional trading signals !

The daily VRM charts below now only display the highest , lowest and S1 sentiments levels. These are the most important sentiment levels.

ONE FILE ATTACHED - ALL LEVELS IN THE ATTACHED CHARTS WERE ON YESTERDAY'S POST

FIRST FILE


Weekly VRM levels in the top 30 minute charts. Daily VRM levels in the bottom 30 minute charts . Daily VRM levels only valid for the last 24 hours. Times are GMT-4 . EMA channel (4,7) included. All charts show the mid-price between the bid and the offer.

GBPUSD started with support on daily level 1.2210. Rose to its high at its highest daily sentiment level 1.2315. Then fell through the middle of its short term trend channel at 1.2236

EURGBP started by rising to its high at daily level 0.8855. Fell to its low at daily level 0.8770. Then rose as GBPUSD fell

EURUSD high at its highest daily sentiment level 1.0836. Low about its daily level 1.0785

USDCAD high at daily level 1.4259 / weekly level 1.4258. Low at the top of its long term trend channel at 1.4099

EURCAD high at daily level 1.5416. Fell through its daily level 1.5248

2020-04-06-GBPUSD-EURGBP-EURUSD-USDCAD-EURCAD-30min-30min.png
 
I attach the VRM predictions for tomorrow 7th April for GBPUSD, EURGBP, EURUSD, USDCAD & EURCAD.

Coloured levels are the important VRM levels. Watch out for the top, middle and bottom of the short term trend channel (blue) colliding with the top, middle or bottom of the long term trend channel (green).

gbpusd.PNG

eurgbp.PNG

eurusd.PNG

usdcad.PNG

eurcad.PNG
 
GBPUSD, EURGBP, EURUSD, USDCAD & EURCAD ---- PREDICTIONS PROVIDED IN YESTERDAY'S POST 11:03 PM T2W TIME

GBPUSD, EURGBP, EURUSD, USDCAD & EURCAD results for 7th April 2020


Volatility Response Model (VRM) described in the first post of this thread.

EURCAD added to complete another triplet. Now there are two triplets.

EURGBP X GBPUSD = EURUSD
EURUSD X USDCAD = EURCAD

The FX pairs follow each other about their respective VRM levels. Good for additional trading signals !

The daily VRM charts below now only display the highest , lowest and S1 sentiments levels. These are the most important sentiment levels.

THREE FILES ATTACHED - ALL LEVELS IN THE ATTACHED CHARTS WERE ON YESTERDAY'S POST

FIRST FILE


Weekly VRM levels in the top 30 minute charts. Daily VRM levels in the bottom 30 minute charts . Daily VRM levels only valid for the last 24 hours. Times are GMT-3 . EMA channel (4,7) included. All charts show the mid-price between the bid and the offer.

GBPUSD low at daily level 1.2203. High at weekly level 1.2371.

EURGBP Supported all day by ts weekly S1 sentiment level 0.8809. High at daily level 0.8860

EURUSD low at its lowest daily sentiment level 1.0780. High at daily level 1.0914

USDCAD supported intially by the top of its long term trend channel at 1.4099. Then fell to weekly level 1.3953

EURCAD moved sideways looking on

LAST TWO FILES

Show weekly VRM levels in the top 5 minute charts. Daily VRM levels in the bottom 5 minute charts . Daily VRM levels only valid for the last 24 hours. Times are GMT-3 . EMA channel (4,7) included. All charts show the mid-price between the bid and the offer. See how the GBPUSD & EURGBP coordinate their price actions about their respective VRM levels. Lots of good trading opportunities.

2020-04-07-GBPUSD-EURGBP-EURUSD-USDCAD-EURCAD-30min-30min.png

2020-04-07-1130-GBPUSD-EURGBP-EURUSD-5min-5min.png

2020-04-07-1455-GBPUSD-EURGBP-EURUSD-5min-5min.png
 
I attach the VRM predictions for tomorrow 8th April for GBPUSD, EURGBP, EURUSD, USDCAD & EURCAD.

Coloured levels are the important VRM levels. Watch out for the top, middle and bottom of the short term trend channel (blue) colliding with the top, middle or bottom of the long term trend channel (green).

gbpusd.PNG

eurgbp.PNG

eurusd.PNG

usdcad.PNG

eurcad.PNG
 
GBPUSD, EURGBP, EURUSD, USDCAD & EURCAD ---- PREDICTIONS PROVIDED IN YESTERDAY'S POST 10:25 PM T2W TIME

GBPUSD, EURGBP, EURUSD, USDCAD & EURCAD results for 8th April 2020


Volatility Response Model (VRM) described in the first post of this thread.

EURCAD added to complete another triplet. Now there are two triplets.

EURGBP X GBPUSD = EURUSD
EURUSD X USDCAD = EURCAD

The FX pairs follow each other about their respective VRM levels. Good for additional trading signals !

The daily VRM charts below now only display the highest , lowest and S1 sentiments levels. These are the most important sentiment levels.

THREE FILES ATTACHED - ALL LEVELS IN THE ATTACHED CHARTS WERE ON YESTERDAY'S POST

FIRST FILE


Weekly VRM levels in the top 30 minute charts. Daily VRM levels in the bottom 30 minute charts . Daily VRM levels only valid for the last 24 hours. Times are GMT-3 . EMA channel (4,7) included. All charts show the mid-price between the bid and the offer.

GBPUSD low at weekly S1 sentiment level 1.2297. High at daily level 1.2418

EURGBP high at daily S1 sentiment level 0.8834. Low at the middle of its long term trend channel at 0.8750

EURUSD initially fell with GBPUSD and made its low at daily level 1.0833

USDCAD low at its daily S1 sentiment level 1.3994. High at daily level 1.4083 / weekly S1 sentiment level 1.4083. Two exactly the same levels calculated from 2 completely different data sets. Not a coincidence.

EURCAD high at weekly S1 sentiment level 1.5298. Low at the bottom of its short term trend channel 1.5212

LAST TWO FILES

Show weekly VRM levels in the top 5 minute charts. Daily VRM levels in the bottom 5 minute charts . Daily VRM levels only valid for the last 24 hours. Times are GMT-3 . EMA channel (4,7) included. All charts show the mid-price between the bid and the offer. See how the GBPUSD & EURGBP coordinate their price actions about their respective VRM levels. Lots of good trading opportunities.

2020-04-08-GBPUSD-EURGBP-EURUSD-USDCAD-EURCAD-30min-30min.png

2020-04-08-1125-GBPUSD-EURGBP-EURUSD-USDCAD-EURCAD-5min-5min.png

2020-04-08-1500-GBPUSD-EURGBP-EURUSD-USDCAD-EURCAD-5min-5min.png
 
I attach the VRM predictions for tomorrow 9th April for GBPUSD, EURGBP, EURUSD, USDCAD & EURCAD.

Coloured levels are the important VRM levels. Watch out for the top, middle and bottom of the short term trend channel (blue) colliding with the top, middle or bottom of the long term trend channel (green).

gbpusd.PNG

eurgbp.PNG

eurusd.PNG

usdcad.PNG

eurcad.PNG
 
GBPUSD, EURGBP, EURUSD, USDCAD & EURCAD ---- PREDICTIONS PROVIDED IN YESTERDAY'S POST 10:13 PM T2W TIME

GBPUSD, EURGBP, EURUSD, USDCAD & EURCAD results for 9th April 2020


Volatility Response Model (VRM) described in the first post of this thread.

EURCAD added to complete another triplet. Now there are two triplets.

EURGBP X GBPUSD = EURUSD
EURUSD X USDCAD = EURCAD

The FX pairs follow each other about their respective VRM levels. Good for additional trading signals !

The daily VRM charts below now only display the highest , lowest and S1 sentiments levels. These are the most important sentiment levels.

THREE FILES ATTACHED - ALL LEVELS IN THE ATTACHED CHARTS WERE ON YESTERDAY'S POST

FIRST FILE


Weekly VRM levels in the top 30 minute charts. Daily VRM levels in the bottom 30 minute charts . Daily VRM levels only valid for the last 24 hours. Times are GMT-3 . EMA channel (4,7) included. All charts show the mid-price between the bid and the offer.

GBPUSD low at weekly level 1.2371. Hiigh made when EURUSD made its high at its weekly level 1.0949

EURGBP low at daily level 0.8731. Hi at daily S1 sentiment level 0.8779

EURUSD low at daily level 1.0840. High at weekly level 1.0949

USDCAD low at daily level 1.3948. High at daily level 1.4066

EURCAD low at daily S1 sentiment level 1.5211. High at daily level 1.5318

LAST TWO FILES

Show weekly VRM levels in the top 5 minute charts. Daily VRM levels in the bottom 5 minute charts . Daily VRM levels only valid for the last 24 hours. Times are GMT-3 . EMA channel (4,7) included. All charts show the mid-price between the bid and the offer. See how the GBPUSD & EURGBP coordinate their price actions about their respective VRM levels. Lots of good trading opportunities.

2020-04-09-GBPUSD-EURGBP-EURUSD-USDCAD-EURCAD-30min-30min.png

2020-04-09-1155-GBPUSD-EURGBP-EURUSD-USDCAD-EURCAD-5min-5min.png

2020-04-09-1512-GBPUSD-EURGBP-EURUSD-USDCAD-EURCAD-5min-5min.png
 
I attach the VRM predictions for tomorrow 10th April for GBPUSD, EURGBP, EURUSD, USDCAD & EURCAD.

Coloured levels are the important VRM levels. Watch out for the top, middle and bottom of the short term trend channel (blue) colliding with the top, middle or bottom of the long term trend channel (green).

gbpusd.PNG

eurgbp.PNG

eurusd.PNG

usdcad.PNG

eurcad.PNG
 
GBPUSD, EURGBP, EURUSD, USDCAD & EURCAD ---- PREDICTIONS PROVIDED IN THURSDAY'S POST 10:02 PM T2W LOCAL TIME

GBPUSD, EURGBP, EURUSD, USDCAD & EURCAD results for 10th April 2020


Volatility Response Model (VRM) described in the first post of this thread.

EURCAD added to complete another triplet. Now there are two triplets.

EURGBP X GBPUSD = EURUSD

EURUSD X USDCAD = EURCAD

The FX pairs follow each other about their respective VRM levels. Good for additional trading signals !

The daily VRM charts below now only display the highest , lowest and S1 sentiments levels. These are the most important sentiment levels.

2 FILES ATTACHED - ALL LEVELS IN THE ATTACHED CHARTS WERE ON LAST POST

FIRST FILE


Weekly VRM levels in the top 30 minute charts. Daily VRM levels in the bottom 30 minute charts . Daily VRM levels only valid for the last 24 hours. Times are GMT-3. EMA channel (4,7) included. All charts show the mid-price between the bid and the offer.

CFD supplier closed at 3:00 am (GMT-3)

GBPUSD supported by daily S1 sentiment level 1.2453

EURGBP supported by lowest daily sentiment level; 0.8766

EURUSD supported by daily S1 sentiment level 1.0922

USDCAD rose to its lowest weekly sentiment level 1.4001. Then fell to weekly level 1.3953

EURCAD supported by its lowest daily sentiment level 1.5252. High at weekly S1 sentiment level 1.5298

SECOND FILE

Shows the 3 hour candlestick charts with EMA channel (4.7) throughout the week with weekly VRM levels for the 5 FX pairs. All charts show the mid-price between the bid and the offer.

GBPUSD supported at weekly level 1.2154. Then cascaded up weekly levels

EURGBP unable to break up through weekly sentiment level 0.8861. Then fell through the middle of its long term trend channel 0.8750

EURUSD supported at its weekly sentiment level 1.0777. Then rallied to weekly level 1.0949

USDCAD tried to break up through weekly level 1.4258 and failed. Then fell to weekly level 1.3953

EURCAD tried to break up through weekly sentiment level 1.5413 and failed. Then fell through weekly S1 sentiment level 1.5298 and went sideways for the rest of the week.

2020-04-10-GBPUSD-EURGBP-EURUSD-USDCAD-EURCAD-30min-30min.png

2020-04-10-GBPUSD-EURGBP-EURUSD-USDCAD-EURCAD-3hr.png
 
I attach the VRM predictions for tomorrow 13th April for GBPUSD, EURGBP, EURUSD, USDCAD & EURCAD.

Coloured levels are the important VRM levels. Watch out for the top, middle and bottom of the short term trend channel (blue) colliding with the top, middle or bottom of the long term trend channel (green).

gbpusd.PNG

eurgbp.PNG

eurusd.PNG

usdcad.PNG

eurcad.PNG
 
Top