Power Squeeze Indicator

Hey all,

On this squeeze indicator, I have a couple of questions .. First, what is the best time frame to use it on ? Is it ok to use on tick charts ? I am testing it out on Futures on mini russel 2000 to see it accuracy. Any particular setting work best for a certain time frame? Thanks !

MC101
 
Does anyone have the BB Squeeze Indicator with ALERT for Metatrader4? If so, would appreciate if you could post a download link. Thanks!
 
ProRealTime: Squeeze + Squeeze Momentum + A Wave

Hi gedward3,

Thanks for your code for the ProRealTime Squeeze Momentum. I am using it together with another indicator that mimics the Squeeze Indicator (i.e. the red and green dots of the original JC TTM_Squeeze) and also with the MACD(13,51,8) [all Fibonacci Numbers :clap: ] as Wave A indicator. Please have a look a the attached Squeeze comparison for the S&P Mini Futures (/ES) on ToS and the SPTRD US 500 Cash of IG Markets in ProRealtime (weekends excluded). How does it look - quite nice for my taste (y)

I would love to revive this thread and get some people involved that know how to write indicators for ProRealTime. My dream would be to get the Squeeze and the Squeeze-momentum in ProRealTime displayed in one indicator to match the TTM_Squeeze design as shown in the right chart on ToS (the indicator in the middle with the red in green dots indicating the squeeze, and the blue and red candles indicating the squeeze momentum).

Looking forward to receiving your replies.
spjuliman


Here is my code copied and pasted straight from my Prorealtime into this msg to be sure nothing is missing.

Ged :D

-------------------------------------------------------------------------------------------------------

Price = Close

REM Length for Average True Range (ATR) & Std. Deviation (SD) Calculations
Length = 20

REM Keltner Channel ATRs from Average
nK = 1.5

REM Bollinger Band Std. Devs. from Average
nBB = 2

REM BBS_Index level at which to issue alerts
AlertLine = 1

REM Calculate BB Squeeze Indicator
monATR = AverageTrueRange[Length](Price)
SDev = STD[Length](Price)

Denom = (nK * monATR)
IF Denom <> 0 THEN
BBSInd = (nBB * SDev) / Denom
ENDIF

IF BBSInd < Alertline THEN
Indic = -1
ELSE
Indic = 1
ENDIF

REM Plot delta of price from Donchian mid line
Histo = LinearRegression[Length] (price - ((Highest[Length](High) + Lowest[Length](Low))/2 + ExponentialAverage[Length](close))/2 )

RETURN Histo as "Histogramme" , Indic coloured by Indic as "Indic"
 

Attachments

  • TTM_Squeeze and  Momentum and  Wave  for ProRealtime MACD(13,55,8) and Squeeze-momentum.png
    TTM_Squeeze and Momentum and Wave for ProRealtime MACD(13,55,8) and Squeeze-momentum.png
    120.9 KB · Views: 2,040
Theres a few things that really get my back up and that is people copying others ideas and then SELLING IT as there own.(n)

A well known commercial trading company are selling the Squeeze indicator for £295. If anyone had a bit of common sense they can get this from the Tradestation forums!

Well, I don't want people paying there hard earned cash so here it is for Tradestation. I use this to good effect on various timeframes and can work on any instrument.

Was developed by John Carter and features in his book. It's based on volatility and uses Bollinger bands and keltner channels and a momentum index oscillator. Your looking for quiet periods when the bollinger bands narrow in width to the point that they are actually trading inside the Keltner channels. This signals the market is taking a breather, building up steam for its next move. The trades signals when the bollinger bands then move back outside the keltner channels. The momentum oscillator is 12 period. If above 0 then go long if below go short.

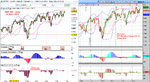
The indicator combines the above. Red dots signify the contract is in a squeeze, blue dots signify that the bollinger bands have moved outside the keltner channles and volatility is increasing. Histogram measures moves momentum. Green bars on blue dots are long signals, and red bars on blue dots are short signals.

You should at least two red dots before considering a potential squeeze. Once a dot turns blue and closes blue for one, five minute period (if using 5min timeframe), then go long if the histogram is green and short if histogram is red.

Stay in the trade until momentum runs out on the histogram. This is indicated by the histograms failure to make a consecutive higher highs if long or consecutive lower lows of short.

p.s. trying to get file uploaded but keeps failing. Will keep trying
p.p.s cant upload but if anyone wants it for Tradestation then just PM
PitBull.... thank you for the Squeeze EL code. It works great! I just have one question though. When I load it into a TradeStation Radar Screen it appears to only work with a "Daily" time frame. However, it works on any time frame with charts. I've cross-checked the issue with another squeeze indicator that I have. Do you have any suggestions on how to get it to work in a Radar Screen for lower time frames (60m, 30m, 10m)? Thanks in advance!
 
The original post was made 16 years ago and Pitbull has not visited this site since 2020 so you may not get an answer.
 
Top