Best Thread Potential setups

Status
Not open for further replies.
missed a nice trade on gb/cad today,never mind.as for spurs,what can i say shocking
 

Attachments

  • gcad.gif
    gcad.gif
    14.8 KB · Views: 189
  • gcad1.gif
    gcad1.gif
    18.5 KB · Views: 207
Hi there Danarm and welcome to the thread!
You an ex-pat or you a Spaniard then? No jokes etc, just noticed your flag!

Canx that. Just read your Journal. Excellent.

Grim
 
Last edited:
looks like AAL/BLT is setting up at the moment, long AAL short BLT:cool:
 

Attachments

  • AAL-BLT.gif
    AAL-BLT.gif
    125.7 KB · Views: 162
Last edited:
GBPJPY update

All

Is this a "winding-up" pattern about to burst?
(Didn't some-one notice something similar last week with Gold?)

btw Spurs, I think my posts got in your way. Are you referring to the oil pins last week?

Paul

This has now been convincingly answered (to the negative). It hasn't managed to fill the gap.
Spot FX GBP_JPY (26-SEP-08).png
Paul
 
Got burnt on GBPYEN today. Tried to play the bottom of the move but got in too early, then tried again and still too early. she took 150 pips off me after a period of consolidation and then went up! Sod's Law. As I was rightly told, I should assess the daily range for 'fakeouts' prior to considering an order against the current move! Inside daily range; poss fake. Outside - poss BO move.

I'm having a few weeks off trading now, prior to being 'out of country' for 4 months.

Keep up the good work, I'll be checking in from afar, and good trading to everyone.
Best wishes,
Grim
 
Hi Tom,
I see everything is going well, I'm very happy for you. I like price action too, no indicators, no EMAs... I love how you master Jim's teachings..you're my idol

Here a nice situation on USD/SEK

Let's start from the weekly. 6,55 is a really strong area and actually it's supporting price. Last week formed a nice pin bar off that support. You can also see a dynamic support
I think that a long on the break of the pin is a good signal. Pin bars on lower time frames can give lower risk entry points

p.s. please let me know about every your initiative..such us posts on other forum or websites virtual tradingroom and so on..I want to improve my trading from you
 

Attachments

  • usdsek.jpg
    usdsek.jpg
    30.1 KB · Views: 156
Last edited:
Hi Tom,
I see everything is going well, I'm very happy for you. I like price action too, no indicators, no EMAs... I love how you master Jim's teachings..you're my idol

Here a nice situation on USD/SEK

Let's start from the weekly. 6,55 is a really strong area and actually it's supporting price. Last week formed a nice pin bar off that support. You can also see a dynamic support
I think that a long on the break of the pin is a good signal. Pin bars on lower time frames can give lower risk entry points

p.s. please let me know about every your initiative..such us posts on other forum or websites virtual tradingroom and so on..I want to improve my trading from you

Canados,

Some good points you mention on that USD/SEK setup.

A few points to make though:

Firstly, I stay away from the exotics because I don't follow them. I like to monitor many markets but to paraphrase my personal idol Jesse Livermore - restrict your speculations to the most actively traded markets. If you cannot make money in these, you will not be able to make money in others. Similar to what Jim (J16) taught me when he said keep to the Weekly and daily TFs. If you cannot make money on these, why do you think you can make money on the 1, 3 or 5m where the trader must be faster to think and faster to execute. So USD/SEK is a no go for me on this principle alone. I keep to what I know well. In FX this is mainly EUR/USD, GBP/USD and USD/JPY (and sometimes a few other JPY pairs such as EUR/JPY and GBP/JPY.

Secondly, although the level is good on that chart, I like the markets to swing into my pins. That is to say, I like to see a sharp move down into a pin or a sharp move up into one that has been sustained over several bars. Think of the elastic band theory - the further you pull it back, the harder it will fly :)

Thirdly, if you want to know about my "initiatives" you need only look as far as this forum: My Making Money Trading thread and this one which I sometimes post in and my journal which I actually may soon be stopping because of work restrictions.

However, to become a master of the markets you need to spend time with them. Reading alone will not help you.

You need screen time. Hours upon ours of studying charts, making observations, recording movements, analysing previous price movements and you need to do this work in isolation.
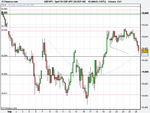
 
Secondly, although the level is good on that chart, I like the markets to swing into my pins. That is to say, I like to see a sharp move down into a pin or a sharp move up into one that has been sustained over several bars. Think of the elastic band theory - the further you pull it back, the harder it will fly :) (y)

thanks for replying and for the time you spend on this forum..I'll continue
 
Last edited:
dec soymeal

continuation pattern in soymeal,DBHLC
 

Attachments

  • Soybean Meal 12-08.png
    Soybean Meal 12-08.png
    9.8 KB · Views: 193
Last edited:
I see pins on EUR/JPY and GBP/JPY on the dailies.

Some problem with loading the charts, but will post soon as I can.
 
I see those pins as well, off some s/r levels too, and a fib level if I remember right. Not much swing into them though. Not sure myself but will be watching them... probably be some good sized gaps tonight!
 
I see those pins as well, off some s/r levels too, and a fib level if I remember right. Not much swing into them though. Not sure myself but will be watching them... probably be some good sized gaps tonight!

Remember you can see the gap before the chart opens by watching XE - The World's Favorite Currency and Foreign Exchange Site.

So far there is a 19 pip gap to the downside on GBP/JPY.

EDIT: 53 pips down now...starting to see some weight here...
 
Last edited:
Hey Guys,
Just a short note of interest. I know I have said before about drawing your SR lines and Pivots on the Line charts and not the H/Ls of the candles. When you plot your Fibs in the same way (H/Ls from the line chart) then just look how accurate the confluence becomes!

I know you can achieve the same by using the bases/tops of the candle body; Try it, you'll be amazed! (well, not the old and bold amongst you!)

I'm out of the market today as I think the whipsaws are too big for me to stomach! The gold H4 pin from Fri has not been broken (the high) yet I'm confused on gold and I think the world is a little confused and not knowing where to turn. I think cash may be the safest holding over the next few weeks (providing the governments don't go and print too much more paper money)

Looks like Bill Bonner hit the nail on the head in his book a couple of years ago, 'Empire of Debt'; a good economic read.

Good trading all, and monitor those open positions closely!
Grim
 
Anyone watching oil, and USD markets?

US Crude is stalling at 38.2 fib from yesterdays fall. Dollar and euro, pound, yen are also at support/resistance areas. No confirmations/pin-bars or the like on the 1hr charts just yet, only a matter of time until this picks up!
 
aveva

i,ll have a look at this in the am,for the isa.either get in on the break of the high of the candle or with a bit of luck a pullback
 

Attachments

  • AVEVA GRP WKLY.png
    AVEVA GRP WKLY.png
    11.4 KB · Views: 147
  • AVEVA GRP.png
    AVEVA GRP.png
    9.8 KB · Views: 193
Status
Not open for further replies.
Top