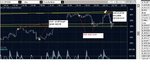
I'd like to short the ES at 848 if it gets there.
I meant 858, and we are here now. I would have liked it more earlier tho...
I'd like to short the ES at 848 if it gets there.
stop at entrance now. Free trade.
Looks like we are exactly the opposite. Thats where I jumped off, after riding it from vwap (850). 😉
I'd like to short the ES at '858' if it gets there.
17 handle drop! The planned trades are usually the good ones.
17 handle drop! The planned trades are usually the good ones.
Hey Tom,
can I ask you what your average risk/return is?
Looking at the EURUSD at the moment to see if it will bounce off the descending TL and 38% fib, where it is stuck now on the 1H.
Well, several months back I went through a period where, when I got in a trade, it would go about as far as the first s/r pivot on my chart and then reverse and take me out. This happened very frequently and yet I didn't really want to adjust what I was doing as it is always my intention to try and catch the big moves and not just play level to level. But I think the market changed and the volatility increased so a lot of my trades were, like I said, going significantly into profit and then stopping me out.
So, I decided to trade two accounts. In both of them I would take exactly the same entries but in the first, I would come out at a target (the first level on my chart) and the second I would trail it in the way I have outlined on this thread.
The stats on these two accounts are very interesting:
Account A: Win/Loss Ratio is 90% with R:R being 1.5:1
Account B: Win/Loss Ratio is 40.25% with R:R being 7:1
Tom
So are we talking a mix of A & B...ie. 2 lots first target level on chart,second trail? or just B
sorry for the dumb question
Pat
The stats on these two accounts are very interesting:
Account A: Win/Loss Ratio is 90% with R:R being 1.5:1 on average
Account B: Win/Loss Ratio is 40.25% with R:R being 7:1 on average

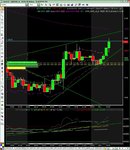
Anyone got any more thoughts on this daily pin on the UsdCad?
It hit a big round number(1.2500) but doesn't the fact that the price is near the bottom of that rising trendline make it less likely that price will fall?
usdcad simply must be short.
daily triangle which broke out and a pullback. previously broke out from 4hr H&S. now with the pull back theres still 2 pin bars on the daily and very bearish price action on 4H, all the outside inside bar u need. plus it has resistance from the downward trendline and the 12400-12500 zone.
get in asap incase the ride down gets rocky and u will be able to hold on longer.
Hi and regards to All, I saw a bullish doji on the EURUSD 1hr earlier today. I didn't enter on the upward break of that pin even though this could have been done. I entered on the 5min chart, scaling in a few lots at the minimums of retracements after this pin. My stop was still below the bottom of the pin initially. Later in the day this area turned into a 4 hr pinbar bouncing off a significant S/R at 50% fib (+2 pips). I have a £10 pp position (demo!!) of a few 2 point lots. I am not good at trade management, but have an idea that 1.3085 might be the most I would get out of this trade before a large retracement. I have my latest stop about 2 pips under the bottom of the hourly pin making the current highest high. I have noticed that this is the same as just keeping it under the last swing low on the 5 minute chart. Another thing going against this trade going much higher is that we are in a multi-week downswing and this trade is counter to that. The next significant resistance I see 1.3148-ish, then 1.3206ish. Any comments re management of this trade would be appreciated. I will likely scale out some of the position at 1.3085.
Regards, Chris Collins🙂