I have nothing going on right now so I figured I'll show a level I'm watching right now.
This is an absolutely fantastic post, lewtz. I will tell you right now, without a shadow of a doubt, that whether this read is right or wrong, watching the market like you are, and
having a plan of what you are going to do if such and such happens, is how you will make money in the long run.
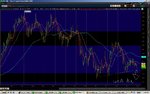
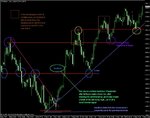
In the daily chart you can see multiple instances of this 140.90 level acting as both Support and Resistance. This level is definitely being watched.
Excellent level. And the important part of what you said is "This level is definetly being watched". Half the hard work is ALREADY done because you now know whereabouts on the chart, a meaningful move is going to occur rather than trying to jump on any move.
Now, how it can be played. First and foremost, I'm going to have to sit patiently while I wait for price to get to this level.
It doesn't get any better than this. You say at the end of your post that you "have a long way to go". If you trade like this, the road to consistency is a lot shorter than you think, mate. I promise you that.
If price does get to this level again, I need to be aware of potential break outs. When price is persistently testing a level like that, the level can hold once, twice or eight times... it doesn't matter. But when price keeps coming back like a magnet it can show a sign that they want to get through this level. Why else would they keep testing it? Your job is to figure out if they're going to fail or succeed.
Spot on again. I am actually wary of a level after it has been tested multiple times like this. After the third time, the market rejects it firmly and then after a big sell off, it comes right back up there. In my opinion, the market wants to take it out, at least to see if any bids come in above it. The market will be keen to see what interest lies above here.
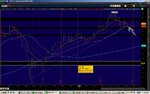
Now lets take a look at the 4h chart.
We've recently had 3 clear tests of the level where sellers have obviously won. Now, after the 3rd test, there is a march downward toward the 130.37 level I have marked. However, we've failed to get that far. That's ok though. We're now pulling back to the 140.90 key level I have marked, but it's looking like we're running into some early trouble when you look at the chart. You can see a pin bar formed before getting to the level and now price is kind of stagnant in a range afterwards, but so far the pin bar is still valid..
As said above, I'd be wary why this hasn't tanked already. You've got another level (although weaker) at 138.75 and the market is making a flag here. I'd actually be running a stop above the last swing high here as the probability of this working, goes down the longer this doesn't break to the downside. This is just in my opinion...
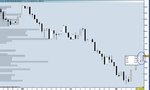
This pin, showing up before it could reach the key level, could be a sign of another leg heading down towards the 130.37 level. This pin bar is what I would call my last stop for the Short Sell express. If I'm going to short, that pin would be where it's at. If I entered below, I would consider it to be chasing the trade. So, it's not exactly at the key level, but let's remember that these levels aren't a specific point in price, but a zone. There's a clear indication of the 140.90 level acting as R. This is followed successive lower lows, which ultimately leads to a strong down move. Now we're pulling back to the 140.90 level and we've come across that pin, which is a good indication that there is another leg down coming.
Not necessarily. Remember, a pin simply means sellers came in. This pin may just mean that traders are getting "nervous" ahead of the big level. Don't presume that a down leg is going to start...but you are right on the zone rather than the exact pivot and you are reading the chart well (lower highs etc)
The context is bearish when you read it from left to right.
I know what you mean but something I should say is that when I am looking for levels, I always try to read RIGHT to LEFT rather than left to right. This goes contrary to our natural way of reading...but market participants often put more of an emphasis on the most recent price action.
It might go up and I'm completely wrong, but at least attempting to add context and make notes about it will help everyone learn quickly what works and what doesn't.
It doesn't matter if you are wrong at all. We all get it wrong from time to time. Just make sure if you trade it, you won't lose more than a fixed amount (i.e. 2% of your account) so that you can afford to keep trading your reads...Also, make notes like you say. This is how you learn. If this doesn't work then next time, you can remember this trade and think, "last time it had three tests and stalled...it only pulled back slightly before blasting through..." This gives you a frame of reference, which is how you build up your edge.
Once again: Great post. Keep up the good work.