Best Thread Potential setups

Status
Not open for further replies.
Trader_Dante - why is it you dismiss the 4 hour timeframe? Wouldn't it be the next logical step to move to after mastering the dailys?

For new traders yes, it would be.

But I need to find a good mix between day trading and position trading and the combination of these two time frames allows me that.
 
hahaha support for brent failed at 4660!!!!!! (check 1 min)


Did anyone else see that happening from the chart I posted before? Can somebody please tell me where I went wrong?

wait there.... it happened how I called it!!!!

Also can anyone else see the dow tanking soon?
 
Last edited:
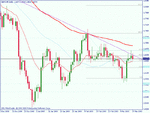
Anyone shorting the CAC, be careful, as the point where the daily pin triggers you have an hourly UPTREND, an S/R pivot and a gap fill. The chances of a short term reversal are high. Best play would be once it has triggered to sell a rally into 2770 or wait for a break and retest.

OK, guys, not trying to prove anything here... just sometimes you can be clever with these calls. The daily candle has a big stop and it doesn't hurt to finesse the entry a little only if you are comfortable doing that. (it is not essential to success in this strategy)

You could sell 50% on the pin break and look for a better entry higher up on the other half if it triggers.

The 2770 level on the CAC was a good opportunity to get in on the short side. A sell at the level only went 11 ticks offside...

You now have a head and shoulders on this CAC. 🙂
 

Attachments

  • cac.gif
    cac.gif
    22 KB · Views: 297
For new traders yes, it would be.

But I need to find a good mix between day trading and position trading and the combination of these two time frames allows me that.

On your 1 hour trades do you work off 1 hour S/R lines or just use those levels plotted at higher TFs - the major S/R levels?

I currently go down to 4 hour PA but I only use daily & weekly levels.
 
On your 1 hour trades do you work off 1 hour S/R lines or just use those levels plotted at higher TFs - the major S/R levels?

I currently go down to 4 hour PA but I only use daily & weekly levels.

I mark 1hr levels in Black (usually) and Daily levels in red so I can differentiate. But I will hit PA at either.
 
Thanks for the Rep T_D, Neil etc but I think it's important to highlight to very new comers.

If I'd listend to TD when I first started trading with some methodology then I'd have saved myself a packet. I thought I knew better and had to find a better way. I have tried all sorts of systems and lost money but I find the most profitable method to be trading these 'pins' at significant levels.
In a way it may be part of the learning process in that one has to go out and lose money/try systems to gain the belief in oneself and their systems, Listen to the sages on these pages and over on Forex Factory et al; how many of the guys who are still in business and profitable use 'squiggly lines' under their charts for entry decisions? - Hardly any? (Please correct me if I'm wrong)

The lure of the next system, newest indicator etc can be very strong; but, In my view, they are of little help. Just learn PA, start by only trading this strategy until you build a good account balance and then maybe syphon off a very small amount to 'test' other stuff/styles you may have read about.

If you are not a Pro with time to be in the market most of the day you will normally get smashed. Trade what you see on the daily chart and refine you entry with your 'tactical' trigger, be it 1hr or 4hr. I now trade in the direction of my Sun night analysis of the weekly charts too as I have found that most of my trades against the weekly have failed - not for everyone

The most important thing of all is to go out, try and find what works for you and then take ownership of that system. Then only you are to blame when things go wrong. Believe in your system and yourself, truly believe and it's a very good start to becoming profitable.

BTW - Anyone looking at gbpchf? Daily pin on decent level but I'm not going against the SNB!! Could be a good chance to get long but I don't often trade this pair as the swings can be quite large. Any clues.
 
Hi guys

Back to gold...there seems to be a very interesting setup coming in gold. There is a long term line on the daily chart the intersects roughly 910...since last October's low of 680.

This also intersects also directly with a low from last week around the same price. Is this a sweet spot worth a reversal? Gold has respected the channels so far.

If I am right...it would be wise to wait for respect of the channel and support. Looking out also for a hammer bottom.

Ritchie
 
Gold - big levels coming up namely 910 and 900. This should be a good area for some action.

With a long bais, I'll look for longs but if 900 goes then we could target the next level below at 850.

My daily up TL is broken and may now offer resistance to any move up.

Most of the big moves in gold tend to happen around the 1200-1400 (zulu) time it seems.

If you 'see' the H&S pattern then look for a neckline break.

Wait for the hammers/stars/IBs on these levels and get in. If you are unsure, wait for the 1-2-3 and play that. Or just watch and learn I guess. There will always be another trade tomorrow 😉
 
Rock on 😈

Same views here...although now with your just in time advice on hammers.

To add: Yes I see the HnS cheers. I foresee some serious volatility if people start to get nervous!


Gold - big levels coming up namely 910 and 900. This should be a good area for some action.

With a long bais, I'll look for longs but if 900 goes then we could target the next level below at 850.

My daily up TL is broken and may now offer resistance to any move up.

Most of the big moves in gold tend to happen around the 1200-1400 (zulu) time it seems.

If you 'see' the H&S pattern then look for a neckline break.

Wait for the hammers/stars/IBs on these levels and get in. If you are unsure, wait for the 1-2-3 and play that. Or just watch and learn I guess. There will always be another trade tomorrow 😉
 
Last edited:
BTW - Anyone looking at gbpchf? Daily pin on decent level but I'm not going against the SNB!! Could be a good chance to get long but I don't often trade this pair as the swings can be quite large. Any clues.

Great posts Grim! I would rep you but they want me to be a slut (again).

I liked the daily candle on the GBPCHF daily because it Is the 50% between recent high (10Feb) and recent low (10Mar) and also an upper trendline you can draw back to 28Nov
Nicola

PS - See Firewalker ... I was listening in your lessons 🙂
 

Attachments

  • gbpchf daily.gif
    gbpchf daily.gif
    17.2 KB · Views: 150
Last edited:
A lesson for any other newbies demo trading.
I took 10 contracts at a 30p stop. This trade required £150 equity.
instead of taking a £2k profit I adjusted my stop to break even and wanted more profits. Greed.
The trade is now closed due to an unexpected (by me anyway lol) 90odd pt surge in prices. Anyway point is don't look at profits as number.... its money you're playing with.

Can someone give their opinion on my charts please

Your line chart because it is not really enough price action information for most. I like line charts for seeing higher lows etc but I like to see the candles too.
This thread is really for price action setups as outlined in Trader Dante's "making Money" thread which is a good read.
Nicola
 
Last edited:
Your line chart because it is not really enough price action information for most. I like line charts for seeing higher lows etc but I like to see the candles too.
This thread is really for price action setups as outlined in Trader Dante's "making Money" thread which is a good read.
Nicola
--------------------------------------------------------------------------------
Quote:
Originally Posted by Aaronmalins
A lesson for any other newbies demo trading.
I took 10 contracts at a 30p stop. This trade required £150 equity.
instead of taking a £2k profit I adjusted my stop to break even and wanted more profits. Greed.
The trade is now closed due to an unexpected (by me anyway lol) 90odd pt surge in prices. Anyway point is don't look at profits as number.... its money you're playing with.

Can someone give their opinion on my charts please


Last edited by elitejets; Today at 01:59 PM. Reason: I was in a bad mood

LOL................
 
Status
Not open for further replies.
Back
Top