grimweasel
Well-known member
- Messages
- 488
- Likes
- 108
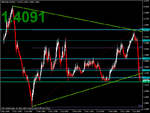
Weekly pin on gold. Very steep upward TL on wkly chart. Could be seen by some as a hanging man candle becuase it's near a top and not really hanging in free space.
Oil has a wkly hanging man candle.
USDYEN on a weekly chart looks like a classic bear flag now. Those wave followers will notice we've only had 2 down moves.
Eurusd I'm confused with. The wkly chart tells me it should go up, but then fundementals tell me it should crash like lemming off a cliff. Talk of Austria on the brink of being bankrupt after lending nearly 80% of GDP to Eastern European countries. Bodes bad for Europe.
Cable is due a retrace back to poss 1.70 region before crashing back down again?
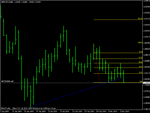
I have recently added another set of charts to my MT4 and all they have is TLs, SR levels and Heiken Ashe candles on. You should try it for the pairs you follow and leave them on the weekly and monthly TFs. The trends/directions stand out like a sore thumb.
Cable for example has broken out of a huge yearly triangle. Look at all that red on this recent down move!


