Best Thread Potential setups

Status
Not open for further replies.
Guys, I think it was Dilesh that originally mentioned them but you should check out VDM Spreads. I just opened an account and am seriously impressed. They match the cash you put in with a bonus (I put in £200 and received £200) but I really like some of their features. They have an account management section which basically takes the results of all your trades and plots an equity curve for you.
 
Yes, you need to do at least 10 live trades for £1pp before you can withdraw it. I have my account to close down if it reaches £300 so at least I walk away with £100 for nothing.

Account is up to £545 atm, TD you want a race?

edit:scratch that idea, you'd beat me.
 
I didn't see them mention that they had to be at £1 per point, just 10 trades whithin 14 days to qualify? Either way, i might give them a go
 
I heard that off rumour. And you can't do trades where you just go long with stop otherside of spread. Get stopped out etc, I think there's something there about suspicious trades.

You can also refer people and you get 3% profits of that person anyone they refer you get 1.5%. hehe
 
Chook, I want you to imagine something.

Imagine that you are a huge trader and you want to buy thousands of Gold contracts.

Also imagine that the more you buy, the more you are going to push the price against yourself as other traders jump in when they see it going up.

Now imagine that you have a price infront of you to buy at but you want a better price (i.e. one lower) because you need to allow for the amount you are going to push it up by buying and also because everyone likes a bargain :)

Now imagine that there is a significant level on the charts that others are looking at. It could be a key support level, for example.

What would happen, if ALTHOUGH YOU WANT TO BE A BUYER, you started using your size to SELL INSTEAD. To push the market down so that you could attract other sellers.

You push it down through the support and in jump the other locals, novices, traders, that start selling, thinking its a breakout.

Then as the price tanks you can buy all you want off these other traders because it is all readily available to you. You can take not only all the ready supply without pushing the price up on yourself but you can get your bargain price :)

In the process, all the selling gets absorbed, the price quickly reverses and shorts begin to bail out or get stopped out...this then pushes the price higher and your profit begins...

This is one reason for a fakeout.

Thanks T_D, makes sense. I think I got caught out like this last week (demo only thankfully).

Price was meant to head north from the 930 S/R level + confluence with 2 Fib levels, and it did briefly before heading south taking out my stop with it. :mad:

I don't like gold much!

But what would I know? Just a newbie...

Anyway I'm off for the weekend..... have a good one people!

HC
 

Attachments

  • Gold.jpg
    Gold.jpg
    179.3 KB · Views: 151
Yes, you need to do at least 10 live trades for £1pp before you can withdraw it. I have my account to close down if it reaches £300 so at least I walk away with £100 for nothing.

Account is up to £545 atm, TD you want a race?

edit:scratch that idea, you'd beat me.

Mate, lets have a race. I put in £200 today and did my first trade. Long Dax. Made £73.

So, up £273. (they haven't put the other £200 in yet)
 
takes the results of all your trades and plots an equity curve for you.

If any one wants to see a parabolic downward curve let me know and i'll sign up for a VM account. Give me one week of trading and i'll have it for you!:LOL:

On that note have a good weekend!!;)

Shane
 
NDX is now approaching Nov lows (1019) but not yet there, just touched the lowest close at 1045 and bouncing off. The bottom can't be found unless all major indices have retested the lows.
 
Mate, lets have a race. I put in £200 today and did my first trade. Long Dax. Made £73.

So, up £273. (they haven't put the other £200 in yet)

Damn, wish i just deleted the post.

FTSE FUT on todays lows and bouncing on it. Cable hourly pin and trendline up.
 
Double (even triple) top on VIX hrly. Indices may bounce soon. INDU small long with 6465 stop is there for the agressive ones!
 
I'm looking to sell the breakout in Bunds.

I didn't sell this in the end...it's broken out and looks like it will close above the previous all time high...guess we are looking at the bullish side of the market now.

Wait for a continuation higher and then a retest of that high during the middle of next week...
 
The thing that I find weird is that I don't think the media is OVERTLY bearish yet. I don't have enough experience of major bear markets as I was still very new to this in the last bear market in early 2000 but I feel like there should be more fear out there before we can properly bottom. I feel like we need a proper panic or a crash so that everyone that wants to sell can sell and everyone that wants to cover their huge position they have built can find ample sellers.

All we are getting at the moment looks like a drift downwards...

But then again, there is a saying that markets find their tops in violence and their bottoms in quiet times. So perhaps we might just drift into a bottom, go sideways for a long while and form some kind of base...

As I said, no idea...just thinking aloud.... :)
 
Last edited:
Double (even triple) top on VIX hrly. Indices may bounce soon. INDU small long with 6465 stop is there for the agressive ones!

INDU bounced back above 6.6k, low of the day @6469 (S1), just 4pts above my stop. :whistling
 
The thing that I find weird is that I don't think the media is OVERTLY bearish yet. I don't have enough experience of major bear markets as I was still very new to this in the last bear market in early 2000 but I feel like there should be more fear out there before we can properly bottom. I feel like we need a proper panic or a crash so that everyone that wants to sell can sell and everyone that wants to cover their huge position they have built can find ample sellers.

All we are getting at the moment looks like a drift downwards...

But then again, there is a saying that markets find their tops in violence and their bottoms in quiet times. So perhaps we might just drift into a bottom, go sideways for a long while and form some kind of base...

As I said, no idea...just thinking aloud.... :)

TD, I think there's scope for a major bear market rally before the indices totally bottom out and kill off the last remnants of hope..
There could be a long way to go yet for markets and economy before we are out of this.
 
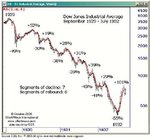
Here is a chart of the great depression from eliiotwave.com
Seven drops and six rallies until the market had declined over 80%.
In comparison we declined 34% followed by a 22% rally and now we have another decline taking us down a total of 50% from the high of 2007.
Hard to believe looking at this that we have seen the worst of it.
Nicola
 

Attachments

  • dow-1930-crash-swings.jpg
    dow-1930-crash-swings.jpg
    89.9 KB · Views: 295
Dax trade: +73 pips

I put in £200 today and did my first trade. Long Dax. Made £73.

So, up £273. (they haven't put the other £200 in yet)

TD, can I enquire of your Dax trade by way of how I might have analysed it at the time.

I am making an assumption here that your Dax trade was triggered off the 11:00 pin on the Hourly chart. If this is not the case then it will invalidate some of the issue.

Prior to the hourly pin forming, I might have drawn the Weekly SR levels at 5131, 4507.8, 4065, 4003. I should certainly have drawn the Daily SR levels. I have them at 4136.5, 3787.4, 3655.1 plus an apparent Downtrend. (See Dax-Daily.jpg)

I might then be watching the Hourly chart. At 11:00 on the Hourly Chart (Dax-Hourly.jpg) a 'good' pin forms (which you would actually see complete at 11:59).
It appears to meet resistance of the Daily 3655 level and forms at the 68% fib. However it is an indication of a counter trend.

Let's say we accept the counter trend and now look at the Hourly plus 1 (Dax-Hourly-(+1).jpg. The 12:00 candle shows that a Buy order would have been opened but that the trade is sitting at a loss. How would you determine that this was still a valid trade at this point?

One way might be to drop to a 30 Min chart. If we do this (Dax-30Mins-(+1.5).jpg) we see that we still have a pin (maybe coincidence), it takes between 12:00 and 12:30 for our entry and stays below the entry level until 12:30 (actually 12:59). Again, how would you determine that this was still a good trade? Are you relying on your initial analysis?

What about looking at the 10 Min chart? (Dax-10Mins-(+1.5).jpg).
We see that the bulk of our original Hourly pin formed at 11:10/11:20 from a 2 candle combo (mentioned elsewhere so interesting to see this). This shows that our buy order would have been triggered between 12:00 and 12:09. However, this candle actually indicates a 'reverse' pin which might suggest that the trade has now finished any up move and will now reverse, which it does for the next 30/40 mins.

All the above would surely suggest not to stay in trade, although it does then move upwards significantly after this.

If this was indeed the pin you traded, did you just hold with your original Hourly pin through to the second hour after entry? I'm sure if I made this trade it would actually have turned down against me. Perhaps this is your 'feel' for the market that you often talk about.

Obviously if this was not your trade then it may not be so significant. However, it would be good to get your take on the analysis please.

Webinvester
 

Attachments

  • Dax-Daily.jpg
    Dax-Daily.jpg
    86.7 KB · Views: 185
  • Dax-Hourly.jpg
    Dax-Hourly.jpg
    79 KB · Views: 209
  • Dax-Hourly-(+1).jpg
    Dax-Hourly-(+1).jpg
    69 KB · Views: 178
  • Dax-30Mins-(+1.5).jpg
    Dax-30Mins-(+1.5).jpg
    75.4 KB · Views: 170
  • Dax-10Mins-(+1.5).jpg
    Dax-10Mins-(+1.5).jpg
    70.5 KB · Views: 153
TD, can I enquire of your Dax trade by way of how I might have analysed it at the time.

I am making an assumption here that your Dax trade was triggered off the 11:00 pin on the Hourly chart.

Correct.

Prior to the hourly pin forming, I might have drawn the Weekly SR levels at 5131, 4507.8, 4065, 4003. I should certainly have drawn the Daily SR levels. I have them at 4136.5, 3787.4, 3655.1 plus an apparent Downtrend. (See Dax-Daily.jpg)

The pin came off the 2004 lows (almost to the tick) forming a huge double bottom (as mentioned when I called it originally). This is what got me in.

However, this is a bear market. And in a bear market, the professionals sell rallies. Therefore, you have to assume that the first resistance is going to get hit hard. As a result, I closed the trade at the first resistance point which was the hourly s/r pivot at 3760. If I had thought that the market may possibly have bottomed, I would have tried to hold but I do not believe for a moment that the market has bottomed and as a result, I did what I considered was the wise thing to do, which was to get out. With hindsight, I timed my exit pretty well but of course, I didn't know this at the time.

The 12:00 candle shows that a Buy order would have been opened but that the trade is sitting at a loss. How would you determine that this was still a valid trade at this point?

Why wouldn't it be valid? The trade is valid until I am stopped out because I put my stop where I feel I am wrong. Until I am proven wrong, I am, of course, right :)

One way might be to drop to a 30 Min chart. If we do this (Dax-30Mins-(+1.5).jpg) we see that we still have a pin (maybe coincidence), it takes between 12:00 and 12:30 for our entry and stays below the entry level until 12:30 (actually 12:59). Again, how would you determine that this was still a good trade? Are you relying on your initial analysis?

Mate, I would never "drop" to any other time frame. As I said above, I am not bothered that it stayed below my entry level. Besides I didn't even know what it was doing because I wasn't even watching it - I was in the coffee room trying to talk some sense into my colleagues who like to get all excited about Non-Farm Payrolls.

What about looking at the 10 Min chart?

This is a recipe for disaster. Leave the 10m time frame for people that like to try and catch every move the market makes. The kind of people that don't mind losing money as long as they are playing the game.

I entered on the hourly time frame and do not look at the market on a lower one.

All the above would surely suggest not to stay in trade, although it does then move upwards significantly after this.

You're completely over analysing it.

Just find a good level.

Watch the price.

Wait for the setup.

Take the trade.

Go read a book or have a coffee or a smoke if you feel you are going to interfere with things or second guess yourself.

If you had done so, you would have come back at the end of the hour and found that the market had tried to move lower, had again found support (look left to the last spike low green candle) and was only a little offside. At that point, you wait to see what happens next...

If this was indeed the pin you traded, did you just hold with your original Hourly pin through to the second hour after entry? I'm sure if I made this trade it would actually have turned down against me. Perhaps this is your 'feel' for the market that you often talk about.

Of course I held it. When I get in, I don't come out unless I am stopped out.
 

Attachments

  • dax.gif
    dax.gif
    21.3 KB · Views: 232
Last edited:
6460 was the low on my chart...but good call nonetheless :)

You were prolly looking at futures. Cash low was 6469.95 as seen on the chart. (though I really don't want to sound like someone who argues with you a lot on this thread :cheesy: )
 

Attachments

  • 090306 $INDU cash.jpg
    090306 $INDU cash.jpg
    46.6 KB · Views: 204
The thing that I find weird is that I don't think the media is OVERTLY bearish yet. I don't have enough experience of major bear markets as I was still very new to this in the last bear market in early 2000 but I feel like there should be more fear out there before we can properly bottom. I feel like we need a proper panic or a crash so that everyone that wants to sell can sell and everyone that wants to cover their huge position they have built can find ample sellers.

All we are getting at the moment looks like a drift downwards...

But then again, there is a saying that markets find their tops in violence and their bottoms in quiet times. So perhaps we might just drift into a bottom, go sideways for a long while and form some kind of base...

As I said, no idea...just thinking aloud.... :)

Tom,
How odd! I just came on this Sat morning to pen exactly that. You beat me to it (as I'd expect). I was only thinking in bed last night when you said you'd closed your DJ shorts - is the media overly bearish at the moment? Is the 'great crash' on the front pages of all the papers? No. This could indicate that all we will see is a bear market rally. I'm not convinced that we have truly reached the bottom yet. And with this mornings announcement that LLoyds now has HMG as the 65% majority shareholder it proves we just don't know the full extent of this toxic debt meltdown yet.

Gold is odd, however, as Moneyweek reports that it was on the frontpages over in the States and that women were having 'gold parties' like tupperware parties, where they traded old gold jewllery with buyers?? Sound's like a possible top?
 
Status
Not open for further replies.
Top