Best Thread Potential setups

Status
Not open for further replies.
Dow & Bund

I think there is going to be the dickens to pay in stocks today.

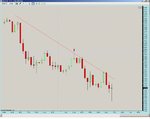
No way is this support at 7878 on the Dow going to last for long. Personally I would sell any rallies because when that goes, we're off to the lows for a double bottom...or armageddon! 😉

Long bonds all the way...

You have to take advantage of times like this as it's basically free money!

DOW & BUND 1hr & Daily
 

Attachments

  • BUND 1hr Jan 21 2009.JPG
    BUND 1hr Jan 21 2009.JPG
    87.7 KB · Views: 214
  • BUND Daily Jan 21 2009.JPG
    BUND Daily Jan 21 2009.JPG
    87.8 KB · Views: 160
  • DOW 1hr Jan 21 2009.JPG
    DOW 1hr Jan 21 2009.JPG
    83.8 KB · Views: 193
  • DOW Daily Jan 21 2009.JPG
    DOW Daily Jan 21 2009.JPG
    90.5 KB · Views: 168
What do you think about DUG today? I have been trading ERY, but given the crude inventories report at 10:30, I wonder if this is a decent alternative? Thanks in advance for any feedback.
 
The Bund is a great buy here at 125.40 up to at least 65s.

If 125.22 goes it's all over though...

That didn't go as anticipated...still think indices will head down through support...don't know when...might be later today or tomorow but when it goes...be on it!! 🙂
 
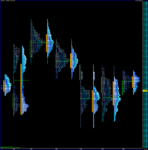
for those that are into this sort of thing...

Grey is 7 day merged, black each day individually

(note: this shows a Histogram of the times and prices that a contract has traded at... the basic idea is that as volume "spikes", the markets is said to have found "value"... these spikes can work out very well as S+R... the letters are for time, the bars are for volume; it's easier to see on the lettters but the volume is equal, if not more, significance. Take all this with a pinch of salt as I am still green behind the ears when it comes to this kind of thing)

its the 125 00 - 10 level that I think will be the thrust behind any move up from here, this 125 - 20ish area is a little sticky... I am biased on the bullish side of things but only very slightly... below that then 124 40 - 50 is the next big level IMO
 

Attachments

  • MP.PNG
    MP.PNG
    45.2 KB · Views: 183
  • 7day_merged.PNG
    7day_merged.PNG
    49.8 KB · Views: 165
What charting package do you use for this?

for those that are into this sort of thing...

Grey is 7 day merged, black each day individually

(note: this shows a Histogram of the times and prices that a contract has traded at... the basic idea is that as volume "spikes", the markets is said to have found "value"... these spikes can work out very well as S+R... the letters are for time, the bars are for volume; it's easier to see on the lettters but the volume is equal, if not more, significance. Take all this with a pinch of salt as I am still green behind the ears when it comes to this kind of thing)

its the 125 00 - 10 level that I think will be the thrust behind any move up from here, this 125 - 20ish area is a little sticky... I am biased on the bullish side of things but only very slightly... below that then 124 40 - 50 is the next big level IMO
 
this is a standard Market Profile, you can get it with nearly all of the well known packages... Don;t know if you can get it for free online because you gotta pay CBOT a subscription
 
I wish i kept my longs in, i do have a feeling a 300+ point retracement might be quite sweet.


@ the 3616 low, price had exceeded it's 5, 10 and 20day average pip ranges of 387, 370, and 324..adding to the probability of a pullback. Difficult though to know where support is as we are in fairly unknown territory.
 
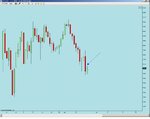
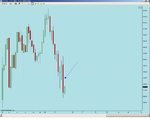
Dow / S&P500 Pattern Correlation Play

Earlier today, the Dow met resistance at Friday's lows.

The S&P500 hasn't yet reached Friday's lows, so it could be a good percentage play to fade the S&P500 at or just before the low.

This is also confluent with a 38.2% fib retracement of the Monday/Tuesday wide-range candle.
 

Attachments

  • Dow.jpg
    Dow.jpg
    59.8 KB · Views: 138
  • S&P500.jpg
    S&P500.jpg
    58.5 KB · Views: 138
Do your own research

...MIZUHO Agree...👍 MIZUHO has had some desent calls on FX and some fixed income for about last 2 years that I have been occationally reading their analysis

Not really - the calls are nothing but simple congestion lines that you can draw yourself. Plenty of imformation about support and resistance level trading on this and other threads on T2W and its free
 
Good call on the Cable guys.

I took this but closed it as we came into the descending TL. It was a quick and easy 170 pips. Although the day could now easily end as a pin and then we may have a lot more to come 🙂

I'll be a buyer on dips right now, until the lows are taken out.
 

Attachments

  • gbp.gif
    gbp.gif
    16.1 KB · Views: 210
What sort of target would you be looking for tomorrow if it does finish as a daily pin?

The part I have the biggest problem with is the exit, i can't tell the difference between a 200pip quickie and something that may turn into 1000 pips if i give it a little bit of time.


(14320 looks like the obvious conservative level to me, but i'm trying to train myself to leave some open for longer... i usually close it at the first significant support level).
 
Good call on the Cable guys.

I took this but closed it as we came into the descending TL. It was a quick and easy 170 pips. Although the day could now easily end as a pin and then we may have a lot more to come 🙂

I'll be a buyer on dips right now, until the lows are taken out.

Has it not already finished the day as a pin?
I.e currencies use 8pm as their close?

I'm going to have to think about this one
 
I wish i kept my long on from 25....

FECK!

You can always tell a top and a bottom when it drops at least 100 pips then retraces in minutes 🙁 GL tomoorrooww
 
Status
Not open for further replies.
Back
Top